1
$\begingroup$

I want to fit derived distribution on real data and I need MLE parameters, standard errors of the estimated parameters, AIC, Loglikelihood, Goodness of fit test (Chi-square, Anderson etc), PDF, CDF, Plots and QQplots. The data,CDF and PDF are

data = {3.70, 2.74, 2.73, 2.50, 3.60, 3.11, 3.27, 2.87, 1.47, 3.11, 
   4.42, 2.41, 3.19, 3.22, 1.69, 3.28, 3.09, 1.87, 3.15, 4.90, 3.75, 
   2.43, 2.95, 2.97, 3.39, 2.96, 2.53, 2.67, 2.93, 3.22, 3.39, 2.81, 
   4.20, 3.33, 2.55, 3.31, 3.31, 2.85, 2.56, 3.56, 3.15, 2.35, 2.55, 
   2.59, 2.38, 2.81, 2.77, 2.17, 2.83, 1.92, 1.41, 3.68, 2.97, 1.36, 
   0.98, 2.76, 4.91, 3.68, 1.84, 1.59, 3.19, 1.57, 0.81, 5.56, 1.73, 
   1.59, 2.00, 1.22, 1.12, 1.71, 2.17, 1.17, 5.08, 2.48, 1.18, 3.51, 
   2.17, 1.69, 1.25, 4.38, 1.84, 0.39, 3.68, 2.48, 0.85, 1.61, 2.79, 
   4.70, 2.03, 1.80, 1.57, 1.08, 2.03, 1.61, 2.12, 1.89, 2.88, 2.82, 
   2.05, 3.65};
cdf = (1 - (1 + ((1 - (1 + x^ξ)^-ψ)^λ/(1 - (1 - (1 + x^ξ)^-ψ)^λ))^γ)^-α)^(β)
pdf = D[cdf, x];
\[ScriptCapitalD] = ProbabilityDistribution[pdf, {x, 0, Infinity}, 
   Assumptions -> α > 0 && β > 0 && γ > 0 && λ > 0 && ψ > 0 && ξ > 0];
$\endgroup$
4
  • 1
    $\begingroup$ your cdf seems not to be copy-able as written... Its therefore difficult to respond to your question. $\endgroup$
    – chris
    Commented Mar 13, 2020 at 10:50
  • $\begingroup$ dear chris I copy and paste from mathematica note book? how will I share you this note book? I mean through email? please send your email. $\endgroup$
    – Amin
    Commented Mar 13, 2020 at 11:25
  • $\begingroup$ With FullSimplify your cdf can be simplified to $\left(1-\left(\left(\frac{1}{\left(1-\left(x^{\xi }+1\right)^{-\psi }\right)^{-\lambda }-1}\right)^{\gamma }+1\right)^{-\alpha }\right)^{\beta }$. $\endgroup$
    – JimB
    Commented Mar 15, 2020 at 17:24
  • $\begingroup$ Actually it can look a little bit simpler: $\left(1-\left(\left(\left(1-\left(x^{\xi }+1\right)^{-\psi }\right)^{-\lambda }-1\right)^{-\gamma }+1\right)^{-\alpha }\right)^{\beta }$. $\endgroup$
    – JimB
    Commented Mar 15, 2020 at 18:10

1 Answer 1

3
$\begingroup$

This is an extended comment rather than an answer.

I think that there are two issues: (1) the amount of data available is inadequate to estimate all 6 parameters, and (2) there is a potential for a severe amount of numeric instability.

A straightforward approach to estimate the parameters is to use FindDistributionParameters:

mle = FindDistributionParameters[data, \[ScriptCapitalD]]
(* {α -> 10.6474, β -> 73.7566, γ -> 67.2255, λ -> 73.7566, ξ -> 67.2255, ψ -> 10.6474} *)

But then try to obtain a plot of the pdf:

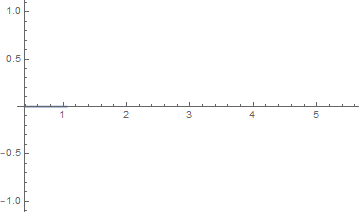
Plot[pdf /. mle, {x, Min[data], Max[data]}]

Attempt at plotting pdf

Generating just 10 bootstrap estimates of the parameters results in the following:

SeedRandom[12345]
boot = RandomChoice[data, {10, Length[data]}];
mle = {α, β, γ, λ, ξ, ψ} /. FindDistributionParameters[#, \[ScriptCapitalD]] & /@ boot;
TableForm[mle, TableHeadings -> {Range[10], {"α", "β", "γ", "λ", "ξ", "ψ"}}]

Bootstrap results

We see only two different values for $\alpha$ and $\psi$ and pairs of estimates are identical: (1) $\alpha$ and $\psi$, (2) $\beta$ and $\lambda$, and (3) $\gamma$ and $\xi$.

So I think your data is woefully inadequate to estimate all of those parameters. You should set some values for the parameters, take a large random sample, and see if the estimates get closer to the true values.

$\endgroup$
2
  • $\begingroup$ @JmB you are right for the data issue, now try for this data and guide me to compute other desired measures; data={83, 51, 87, 60, 28, 95, 8, 27, 15, 10, 18, 16, 29, 54, 91, 8, 17, 55, 10, 35, 47, 7, 36,17, 21, 36, 18, 40, 10, 7, 34, 27, 28, 56, 8, 25, 68, 146, 89, 18, 73, 69, 9, 37, 10, 82, 29, 8, 60, 61, 61, 18, 169, 25, 8, 26, 11, 83, 11, 42, 17, 14, 9, 2}; $\endgroup$
    – Amin
    Commented Mar 14, 2020 at 13:24
  • $\begingroup$ If that is your data possibly from the distribution you gave, then rounding to the nearest integer loses information and makes it even harder to estimate parameters. You might need to get advice from both a statistician and from someone better versed in numerical analysis than me. $\endgroup$
    – JimB
    Commented Mar 14, 2020 at 18:58

Your Answer

By clicking “Post Your Answer”, you agree to our terms of service and acknowledge you have read our privacy policy.

Not the answer you're looking for? Browse other questions tagged or ask your own question.