3
$\begingroup$

I have the following plot

Show[Graphics[Axes -> True], ParametricPlot[al[t], {t, 0, 1}], 
 ParametricPlot[be[t], {t, 0, 1}]]

where al[t] and be[t] are parametric plots of a BezierFunction.

I would like to add arrows to the midpoint of the parametric plots. I have tried using the Arrow command but this does not work. Is there anyway to do this easily?

$\endgroup$
4
  • 1
    $\begingroup$ It would be nice to have a working example. Without that, consider something like: ParametricPlot[{Sin[u], Sin[2 u]}, {u, 0, 2 Pi}] /. Line[x__] :> Arrow[x] $\endgroup$
    – ktm
    Commented Mar 5, 2020 at 18:30
  • $\begingroup$ Thank you for this @user6014, this works just fine. Is there a way to adjust the size of the arrowhead using this method? $\endgroup$
    – Dan M
    Commented Mar 5, 2020 at 18:44
  • 6
    $\begingroup$ We're getting fast and loose with "documented" functionality, but try: ParametricPlot[{Sin[u], Sin[2 u]}, {u, 0, 2 Pi}] /. Line[x__] :> Sequence[Arrowheads[.5], Arrow[x]] (adjust size of arrowhead as needed). This might not be robust in all situations. $\endgroup$
    – ktm
    Commented Mar 5, 2020 at 18:55
  • $\begingroup$ This works just as I need it, thank you so much! $\endgroup$
    – Dan M
    Commented Mar 6, 2020 at 7:51

2 Answers 2

6
$\begingroup$
SeedRandom[1]
al = BezierFunction[RandomReal[{-1, 1}, {14, 2}]];
be = BezierFunction[RandomReal[{-1, 1}, {20, 2}]];

You can temporarily redefine Line as Arrow using Block and use ParametricPlot:

Block[{Line = Arrow}, 
  ParametricPlot[{al[t], be[t]}, {t, 0, 1}, PlotRange -> All, Frame -> True, Axes -> False]]
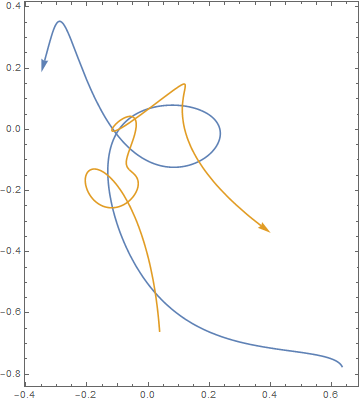
enter image description here

Alternatively, you can use Graphics

Graphics[{Thick, 
  MapThread[{#, Arrow[#2 /@ Subdivide[200]]} &, 
   {ColorData[97] /@ {1, 2}, {al, be}}]}, 
 Frame -> True]

same picture

You can specify the size and position of the arrow heads using the directive Arrowheads[{{size, pos}}]:

Block[{Line = Arrow}, 
 ParametricPlot[{al[t], be[t]}, {t, 0, 1}, 
  PlotStyle -> Arrowheads[{{.05, .75}}], PlotRange -> All, 
  Frame -> True, Axes -> False]]
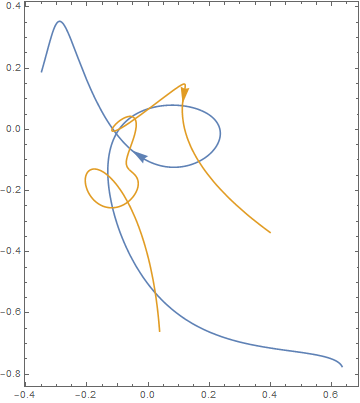
enter image description here

Alternatively, with Graphics:

Graphics[{Arrowheads[{{.05, .75}}], Thick, 
  MapThread[{#, Arrow[#2 /@ Subdivide[200]]} &, {ColorData[97] /@ {1, 2}, {al, be}}]}, 
 Frame -> True]

same picture

$\endgroup$
0
$\begingroup$

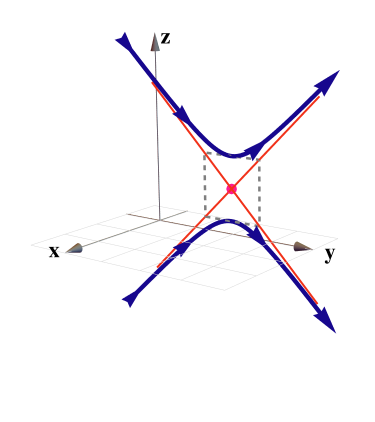
To put arrows in a curve I usually use this code

ParametricPlot[...] /. Line[fig___] :> {Arrowheads[ConstantArray[0.06, 4]], Arrow[fig]};

enter image description here

The complete code:

r1[t_] = {-1 + 2 Cos[t], 2 Sin[t], 0};
r2[t_] = {0, 2 + 2 Sinh[t], -2 + 2 Cosh[t]};
p1 = {0, 2 - Sqrt[1/2], 1 - Sqrt[1/2]}; p2 = {0, 2 + Sqrt[1/2], 
  1 + Sqrt[1/2]};
q1 = {0, 2 + Sqrt[1/2], 1 - Sqrt[1/2]}; q2 = {0, 2 - Sqrt[1/2], 
  1 + Sqrt[1/2]};
c2 = ParametricPlot3D[{0, 2 + Sqrt[1/2] Sinh[t], 
     1 + Sqrt[1/2] Cosh[t]}, {t, -2, 2},
    Mesh -> None, PlotStyle -> {AbsoluteThickness[3.5]}] /. 
   Line[fig___] :> {Arrowheads[ConstantArray[0.06, 4]], Arrow[fig]};
c3 = ParametricPlot3D[{0, 2 + Sqrt[1/2] Sinh[t], 1 -
      Sqrt[1/2] Cosh[t]}, {t, -2, 2},
    Mesh -> None, PlotStyle -> {AbsoluteThickness[3.5]}] /. 
   Line[fig___] :> {Arrowheads[ConstantArray[0.06, 4]], Arrow[fig]};

Graphics3D[{
  First@c2,
  First@c3,
  AbsolutePointSize[8.5], Orange, Point[{{0, 2, 1}}],
   Thick, Line[{ p1 - (p2 - p1), p1 + 2 (p2 - p1)}],
   Line[{ q1 - (q2 - q1), q1 + 2 (q2 - q1)}],
  Dashed, Thick, Gray, Line[{p1, q1, p2, q2, p1}]},
 Boxed -> False, PlotRange -> All]
$\endgroup$

Your Answer

By clicking “Post Your Answer”, you agree to our terms of service and acknowledge you have read our privacy policy.

Not the answer you're looking for? Browse other questions tagged or ask your own question.