0
$\begingroup$

I am plotting a 3D plot of my set of ODEs. The ODEs are as follows:

H = Sqrt[(1/
3)*((0.5/(a^6*V^2 *Exp[6*t]))*(P[t]^2 + 0.5*sig^2) + (0.25*m^2*
M^2)*(1 - Exp[-1/(sig^2*M^2)]*Cos[2 *\[Psi][t]/M]))]; 
eqs = {\[Psi]'[t] == P[t] Exp[-3 t]/(H a^3  V), 
P'[t] == (-0.5/H) ( 
a^3 V Exp[3 t]*M* m^2 Exp[-1/(M^2*sig^2)] Sin[2 \[Psi][t]/M])};

I want to plot a phase portrait with following variables on my axes, (t, $\frac{P}{e^{3t}}$, $\phi$). The thing that confuses me here is I have tried to plot it by using the 3d parametric plot command and my code is here as follows,

The solution to equations is:

sol = ParametricNDSolve[{eqs /. {M -> 1, m -> 100, V -> 10, a -> 1, 
sig -> 15}, \[Psi][-10] == c, P[-10] == b}, {\[Psi], 
P}, {t, -10, 12}, {c, b}, MaxSteps -> 100000];

The plot is done by using:

  plot1 = ParametricPlot3D[
  Flatten[Table[{t, \[Psi][c, b][t], P[c, b][t]/Exp[3*t]}, {c, -3, 
  3}, {b, -3, 3}], 1] /. sol // Evaluate, {t, -10, 12}, 
  BoxRatios -> {1, 1, 1}, AxesLabel -> {"N", "\[Phi]", "P"}, 
  Boxed -> False, PlotLabel -> "m=100,M=5", 
  ColorFunction -> Function[t, Hue[t]]]

This plot vanishes the visualization of initial conditions, i.e. the plots don't start from t=-10 instead from somewhere at about t=0. The initial conditions are at t=-10 so the trend should be visible at t=-10. Have I done something wrong by writing: P[c, b][t]/Exp[3*t], in the parametric3d plot command?` Secondly, I tried to plot H vs t, by using the parametric plot command but an empty plot occurs. Any leads would be appreciated.
The sample plot(researchgate.net/figure/3-dimensional-phase-portrait-of-the-system-51-assuming-a-quadratic-potential-with-g_fig2_265967212) has all its trajectories starting from t=-10 (there, t is represented by N). I tried to plot H vs t by using the following code:

ParametricPlot[
Flatten[Table[H, {c, -3, 3}, {b, -3, 3}], 1] /. sol // 
Evaluate, {t, -10, 9}

]

$\endgroup$

1 Answer 1

1
$\begingroup$

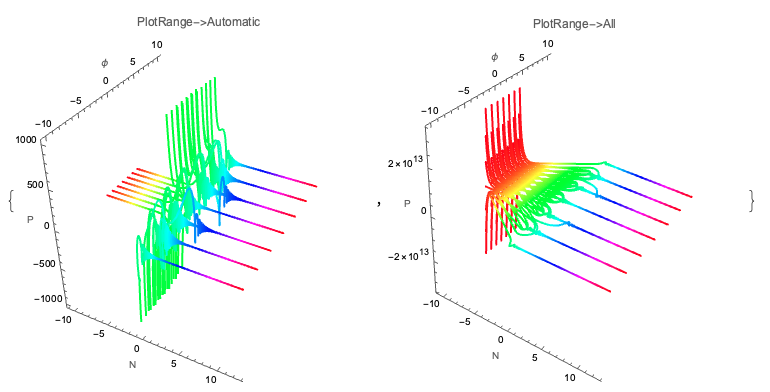
Mathematica is "helpfully" adjusting the ranges of the plot (particularly the range of P) to allow for more detail in the region $N > 0$. You can force Mathematica to show the entire plot by using the PlotRange -> All option.

enter image description here

Note the difference in "vertical" range between the two plots. It appears that most of your phase space trajectories grow exponentially if you project them back to negative time. Whether or not this is reasonable given the physical situation you're looking at, I cannot say; but that seems more likely be a problem translating the physics into the software rather than a problem with the software itself.

$\endgroup$
8
  • $\begingroup$ Thank you Seifert. One more question, I tried plotting H vs t. I did it by using, {p, $\phi$, H } in ParametricNDSolve command. I will show you my attempt. $\endgroup$
    – Jpmg
    Commented Aug 30, 2021 at 18:36
  • $\begingroup$ Secondly, is there a method through which I can see the coordinates in this plot? I tried using the drawing tool and it didn't work. $\endgroup$
    – Jpmg
    Commented Aug 30, 2021 at 18:53
  • $\begingroup$ @Jpmg: I don't know of a good way to get coordinates on a 3D plot; it seems obvious to me that it would be a much harder to create an interface like the 2D "Get Coordinates" tool in 3D. If I needed to get coordinates this way, I would probably plot one trajectory projected into 3 different 2D plots (one for each pair of axes) and infer it from that. $\endgroup$ Commented Aug 30, 2021 at 19:04
  • 1
    $\begingroup$ For plotting H as a function t, it doesn't seem like you would need ParametricPlot3D to do it. Something like Plot[ Table[H /. sol, {c,-3,3}, {b,-3,3}], {t, -10, 15}] would probably do just fine (though I have not tested this, so the syntax may be wrong.) $\endgroup$ Commented Aug 30, 2021 at 19:07
  • 1
    $\begingroup$ Let us continue this discussion in chat. $\endgroup$ Commented Aug 31, 2021 at 20:12

Your Answer

By clicking “Post Your Answer”, you agree to our terms of service and acknowledge you have read our privacy policy.

Not the answer you're looking for? Browse other questions tagged or ask your own question.