4
$\begingroup$

I am trying to plot a function over a tirangular region

   F[x_, y_] := -(0.1/x)*(Log[(x - y)/0.1])
   Plot3D[F[x, y] , {x, 0.1, 3}, {y, 0, 5}, 
   RegionFunction -> Function[{x, y}, x > y], 
   PlotRange -> {-2, 1}, AxesLabel -> Automatic, Mesh -> 60] 

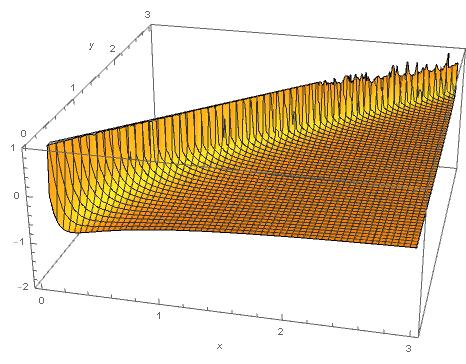
and I get some a jagged surface on one boundary.

I appreciate the surface is very steep on the $x=y$ line, and it could pose numerical difficulties.

Yet, is there a workaround to obtain a more aesthetically pleasing plot?

Thanks

$\endgroup$
7
  • 1
    $\begingroup$ can't run your code. F100234 not defined. $\endgroup$
    – Nasser
    Commented Feb 11, 2020 at 8:37
  • $\begingroup$ My apologies, should be corrected now, thanks $\endgroup$
    – Smerdjakov
    Commented Feb 11, 2020 at 8:40
  • 1
    $\begingroup$ I get different plot. V 12. Screen shot !Mathematica graphics $\endgroup$
    – Nasser
    Commented Feb 11, 2020 at 8:44
  • $\begingroup$ Adding PlotPoints -> 100 might help. $\endgroup$ Commented Feb 11, 2020 at 8:46
  • $\begingroup$ @Nasser, please consider my further edit, I have checked it now twice, sorry. $\endgroup$
    – Smerdjakov
    Commented Feb 11, 2020 at 8:49

1 Answer 1

3
$\begingroup$

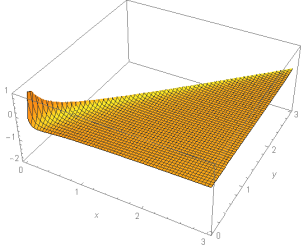
Add Boole to the plot argument:

Plot3D[F[x, y] Boole[x >= y], {x, 0.1, 3}, {y, 0, 5},RegionFunction -> Function[{x, y}, x > y], PlotRange -> {-2, 1},AxesLabel -> Automatic, Mesh -> 60]

enter image description here

$\endgroup$
2
  • $\begingroup$ works well, thanks $\endgroup$
    – Smerdjakov
    Commented Feb 11, 2020 at 20:21
  • $\begingroup$ You're welcome. $\endgroup$ Commented Feb 11, 2020 at 21:55

Your Answer

By clicking “Post Your Answer”, you agree to our terms of service and acknowledge you have read our privacy policy.

Not the answer you're looking for? Browse other questions tagged or ask your own question.