6
$\begingroup$

I am trying to find the solution to Laplace's equation:

$\dfrac{\partial^2 u}{\partial x^2}+\dfrac{\partial^2 u}{\partial y^2}=0$

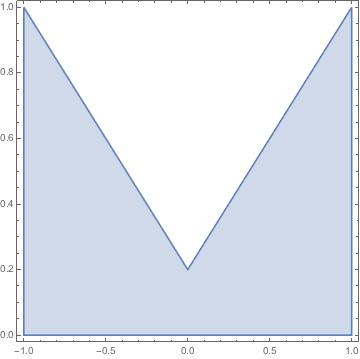
over the following region of space:

enter image description here

the vertices of the triangle are (-1,1), (1,1) and (0,.2). I defined the region using RegionDifferrence.

My boundary conditions are:

$u=0$ when $-1\leq x\leq 1, y=0$ and $u=0.1$ along the two edges of the triangle enclosing the domain.

I am interested in the electric field $\nabla u$. I setup the system in NDSolve using the following code:

uval = NDSolveValue[{D[u[x, y], x, x] + D[u[x, y], y, y] == 0,
    DirichletCondition[u[x, y] == 0, -1 <= x <= 1 && y == 0],
    DirichletCondition[u[x, y] == .1, 0 <= x <= 1 && y == .8 x + .2],
    DirichletCondition[u[x, y] == .1, -1 <= x <= 0 && y == -.8 x + .2]}, 
    u, {x, y} ∈ Ω, 
    InterpolationOrder -> All, 
    WorkingPrecision -> MachinePrecision, 
    AccuracyGoal -> $MachinePrecision,
PrecisionGoal -> $MachinePrecision];

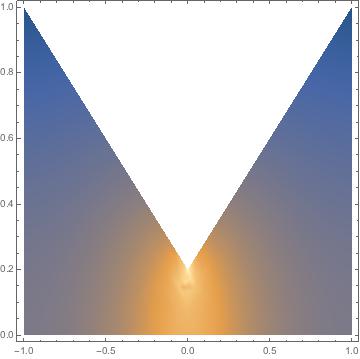
I then use DensityPlot to visualize the derivative $u'(x,y)$:

enter image description here

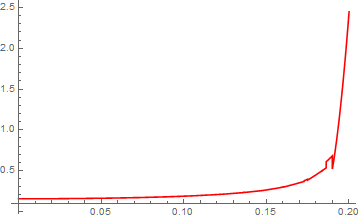
Clearly something doesn't look right in the derivative plot as the field between the tip and the plate seems non-monotonic along the line $x=0$. I would expect the field to decrease monotonically between 0.1 units at the tip to 0 units at the plate.

Question 1: Is this a problem with Plot or with the solution given by NDSolve itself?

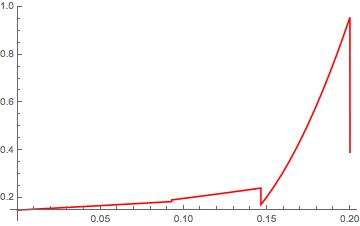
I tried playing around with PlotDesntiy and Maxrecursion to no avail. We see the trouble even more clearly if we plot $u_y(0,y)$ i.e. the y component of the field along the line $x=0$:

ClearAll[dy]
dy[a_, b_] := D[uval[x, y], y]^2 /. {x -> a, y -> b};
Plot[dy[0, c], {c, 0, .2}, PlotStyle -> Red, PlotRange -> All]

enter image description here

Clearly the field in this physical problem cannot be discontinuous as we see above. I did some searching here and came across this post, in which Question 5 seems identical to my problem: Calculating a potential function using the finite element method

The poster above is using an FEM mesh which seemed to be the source of their jagged plot. Based on this, my hypothesis is that the interpolation/stepsize used by NDSolve here is not fine enough to give me a smooth derivative. So for my problem I tried changing a variety of NDSolve parameters such as InterpolationOrder, Method, MaxStepFraction and many others, but nothing seemed to change the output.

Question 2: Should I solve my problem with a 2D FEM scheme and adopt the solution in the link above?

Finally, when I use the solution determined by NDSolve to test it with the boundary condition for example uval[1,1] I get the following error message:

InterpolatingFunction::dmval: "Input value {1.,1.} lies outside the range of data in the interpolating function. Extrapolation will be used."

This seems to suggest that the boundary of my defined region is not included in the domain of {x,y}? How do I include the boundary too? The way I define my region is as below, although it does output the correct value of 0.1:

Ω = 
  RegionDifference[
    Rectangle[{-1, 0}, {1, 1}], 
    Triangle[{{-1, 1}, {1, 1}, {0, .2}}]];
$\endgroup$
1
  • 1
    $\begingroup$ Wonderful nickname +1 $\endgroup$ Commented Jul 26, 2015 at 3:13

1 Answer 1

13
$\begingroup$

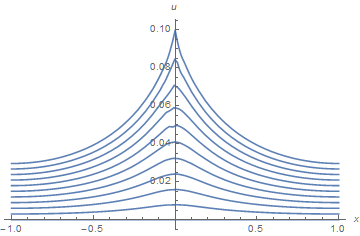
Two problems are involved here. The electric field is ill-behaved at a sharp point, and computational resolution is limited. The first can be seen by plotting the potential, uval, calculated using the code in the Question, for various values of y.

Plot[Table[uval[x, y], {y, 0, .2, .02}], {x, -1, 1}, AxesLabel -> {x, u}]

enter image description here

Notice the cusp developing near {0, .2}. Second, resolution is limited for NDSolveValue default parameters.

Needs["NDSolve`FEM`"]
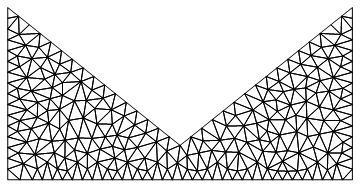
uval["ElementMesh"]["Wireframe"]

enter image description here

Only two or three finite elements resolve the distance between the point and the ground plane. To increase the number, use the NDSolveValue option,

Method -> {"FiniteElement", "MeshOptions" -> {MaxCellMeasure -> 0.0001}}

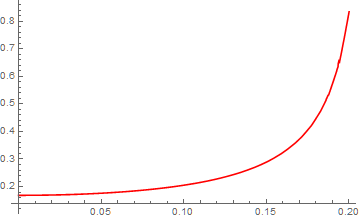
which puts about twenty finite elements between the point and the ground plane. With this change, the third plot in the question becomes,

enter image description here

which is much smoother but also has a peak value more than three times as large. As MaxCellMeasure is further decreased, the peak value will further increase.

To address the three specific questions in the Question,

  1. The jagged curve plotted is due to limited resolution used by NDSolveValue, as well as to the underlying physics.
  2. NDSolveValue uses FEM by default for computations with irregular boundaries.
  3. I do not believe that the warning message reproduced in the Question has anything to do with the jagged curve.

Addition

An alternative to the option given above,

Method -> {"FiniteElement", "MeshOptions" -> {"MaxBoundaryCellMeasure" -> 0.01,
   "BoundaryMeshGenerator" -> "Continuation"}}

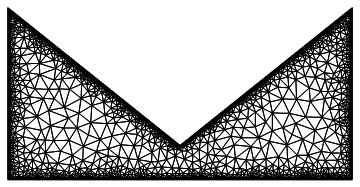
also can be used, as in question 59261, referenced in the Question here. It has the advantage of concentrating resolution near the boundary,

enter image description here

Using this option choice yields only a slightly smoother plot of electric field at x = 0 than the one shown earlier in this Answer, with a peak value of about 4.3 instead of 2.5.

Second Addition

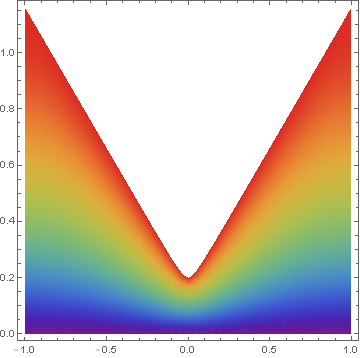
As suggested in comments below, more realistic results can be obtained by rounding the tip of the electrode. A "Goldilocks" choice is appropriate: the radius of curvature of the tip should be small enough that it does not distort the overall profile of the potential in the gap but large enough that it can be represented by a reasonable number of finite elements. For instance,

Ω = ImplicitRegion[-1 < x < 1 && 0 < y < Sqrt[x^2 + .04^2] + .16, {x, y}];
uval = NDSolveValue[{D[u[x, y], x, x] + D[u[x, y], y, y] == 0, 
         DirichletCondition[u[x, y] == 0, -1 <= x <= 1 && y == 0], 
         DirichletCondition[u[x, y] == .1, -1 <= x <= 1 && y == Sqrt[x^2 + .04^2] + .16]}, 
         u, {x, y} ∈ Ω, InterpolationOrder -> All, 
         Method -> {"FiniteElement", "MeshOptions" -> {MaxCellMeasure -> 0.00002}}];

which gives an almost smooth electric field at x = 0.

enter image description here

For completeness, the overall potential distribution is

DensityPlot[uval[x, y], {x, y} ∈ Ω, ColorFunction -> "Rainbow", PlotPoints -> 50]

enter image description here

$\endgroup$
3
  • 1
    $\begingroup$ Thanks, this was very helpful! Perhaps I should add a small circular feature at the tip. This is also more physical probably. $\endgroup$ Commented Jul 26, 2015 at 13:08
  • $\begingroup$ @G.H.Hardly I believe that the peak electric field at the tip scales as the reciprocal of the electrode radius of curvature there. Adding a small circular feature makes sense. I suggest that you make it as big as possible while still being smaller than the scale length of features of the field that you wish to represent. Thanks for accepting my answer. $\endgroup$
    – bbgodfrey
    Commented Jul 26, 2015 at 13:17
  • $\begingroup$ You're right - I think any smooth feature would help my case, however tiny the radius, because my function is currently non-differentiable at the tip, so I am bound to run into problems with I try and calculate the derivative there. $\endgroup$ Commented Jul 26, 2015 at 14:06

Your Answer

By clicking “Post Your Answer”, you agree to our terms of service and acknowledge you have read our privacy policy.

Not the answer you're looking for? Browse other questions tagged or ask your own question.