6
$\begingroup$

In expressions like

Plot[Through@{# &, #^2 &}@x, {x, -1, 1}]

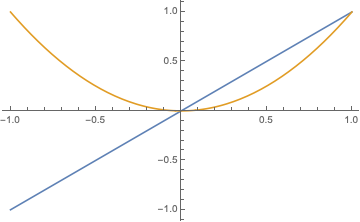
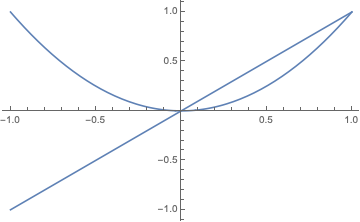
Plot effectively interprets the first argument as a vector-valued function, and plots both lines in the same colour:

enter image description here

To make Plot interpret the first argument as a list of functions, we need to wrap the argument in Evaluate, as in

Plot[Evaluate@Through@{# &, #^2 &}@x, {x, -1, 1}]

yielding

enter image description here

But what if the list of functions is a list of PredictorFunction objects, each of which expects a numeric, or "Numerical", argument?

predictors = Predict[{1 -> 1, 2 -> 0, 3 -> -1, 4 -> 0}, Method -> #] &
    /@ {"DecisionTree", "GaussianProcess"};
Plot[Evaluate@Through@predictors@x, {x, 0, 5}]

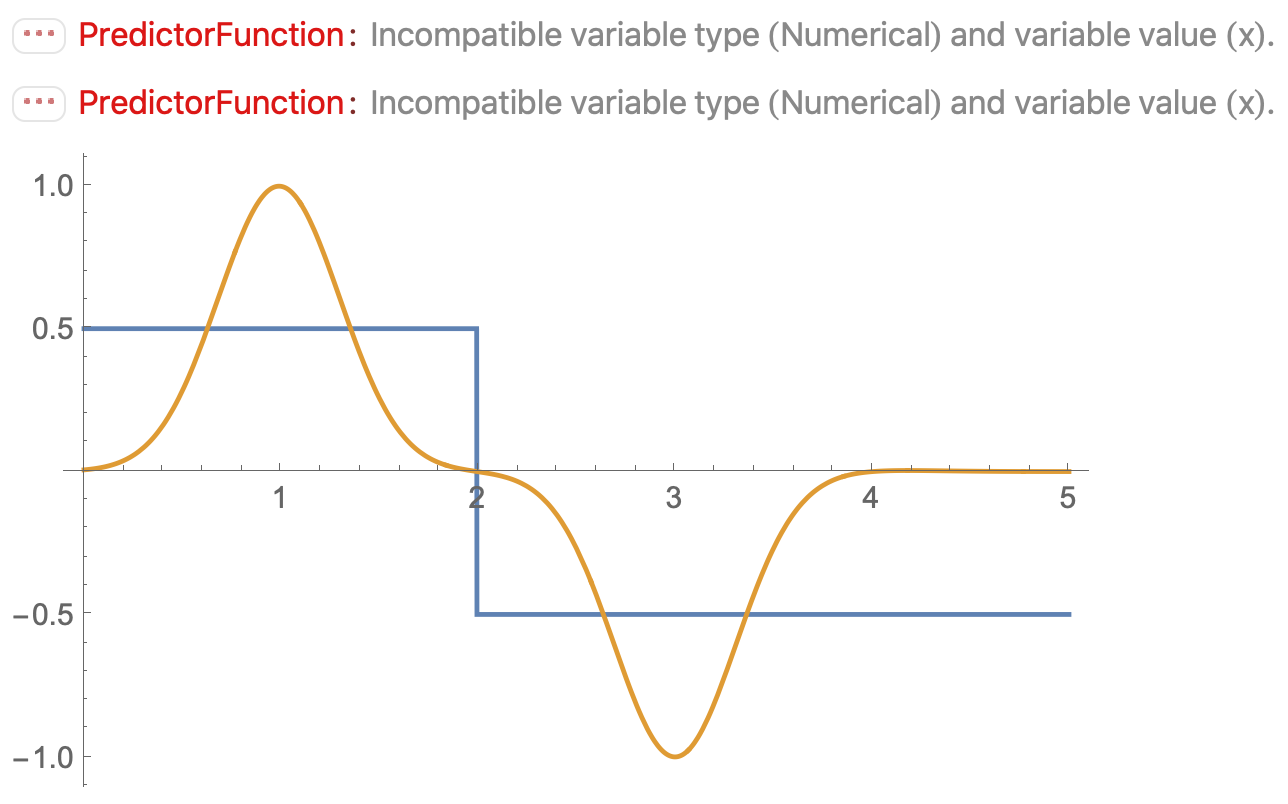
This yields the desired plot

enter image description here

but with PredictorFunction::mlincfttp errors. Is there a way of doing this without generating the errors and without using Quiet to suppress them? I need to pass the predictors as a list just like predictors; there are too many to write out explicitly in the first argument to Plot, as in {p1[x], p2[x], ...}; I need a programmatic solution.

$\endgroup$
2
  • $\begingroup$ If you cannot suppress the warning message, by wrapping your whole code in Quiet[], perhaps you can use Off[PredictorFunction::mlincfttp] before the code is executed. Would that work? $\endgroup$
    – Michael E2
    Commented Jan 21, 2020 at 15:36
  • $\begingroup$ It would work, thanks @MichaelE2. But I'm really looking for something which doesn't generate any errors and therefore doesn't have to suppress them. $\endgroup$ Commented Jan 23, 2020 at 5:39

2 Answers 2

8
$\begingroup$

If Off[PredictorFunction::mlincfttp] won't work, perhaps this:

(* holds up evaluation until x is numeric *)
ClearAll[applyN];
applyN[f_][x_?NumericQ] := f[x];

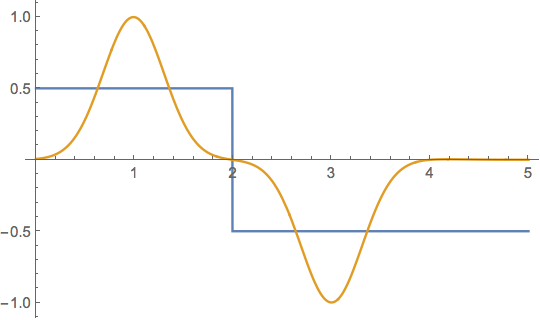
Plot[Evaluate@Through@(applyN /@ predictors)@x, {x, 0, 5}]

enter image description here

$\endgroup$
1
  • $\begingroup$ Brilliant, this is exactly what I'm looking for. $\endgroup$ Commented Jan 23, 2020 at 5:46
6
$\begingroup$

You could try with:

Show[Plot[#[x], {x, 0, 5}, PlotStyle -> RandomColor[]] & /@ 
  predictors]

Or if you want the same colorscheme for each plot:

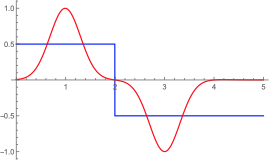
colors = {Blue, Red};
Show[Plot[predictors[[#]][x], {x, 0, 1}, PlotStyle -> colors[[#]]] & /@
   Range@Length[predictors],PlotRange -> All]

enter image description here

$\endgroup$
2
  • $\begingroup$ The {x, 0, 1} should be {x, 0, 5} to reproduce the plot shown in the image. $\endgroup$ Commented Jan 21, 2020 at 15:44
  • $\begingroup$ true, I forgot to change it back $\endgroup$
    – Fraccalo
    Commented Jan 21, 2020 at 18:22

Your Answer

By clicking “Post Your Answer”, you agree to our terms of service and acknowledge you have read our privacy policy.

Not the answer you're looking for? Browse other questions tagged or ask your own question.