2
$\begingroup$

I have managed to manipulate functions from a list of data points. The data table is large and thus is in this link.

data = Import["util.dat"]
Clear[utl]
utl[x1_, g_, G_] := 
 1/(1 + Exp[(4.39445/(g - G)) x1 + (2.19722 (g + G)/(G - g))])
Manipulate[ListContourPlot[
  {#[[1]], #[[2]], 
     utl[#[[3]], g1, G1]* utl[#[[4]], g2, G2]*utl[#[[5]], g3, G3]} & /@
    data, PlotLegends -> Automatic
  ], {g1, 0.001, 10, 0.001}, {G1, 0.01, 10, 0.001}, {g2, 0.001, 10, 
  0.001}, {G2, 0.01, 10, 0.001}, {g3, 0.001, 10, 0.001}, {G3, 0.01, 
  10, 0.001}]

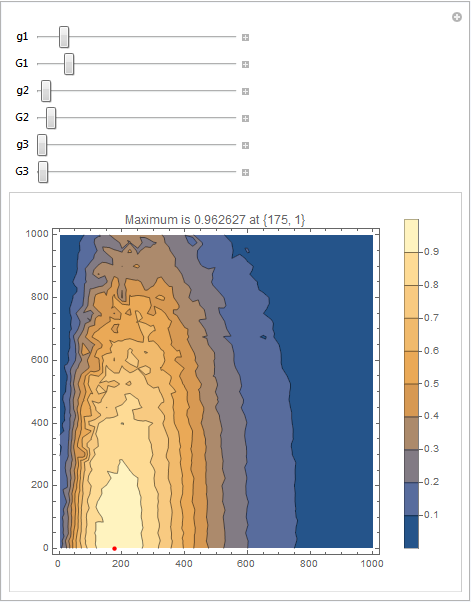
An example of representation giving parameters g1,G1,g2,G2,g3,G3 can be the following:

enter image description here

I would like is to plot the point of the maximum value of the utl[] function and to get the numbers of the first and second columns from data (the coordinates in the ListContourPlot[]) of that point.

$\endgroup$

1 Answer 1

4
$\begingroup$
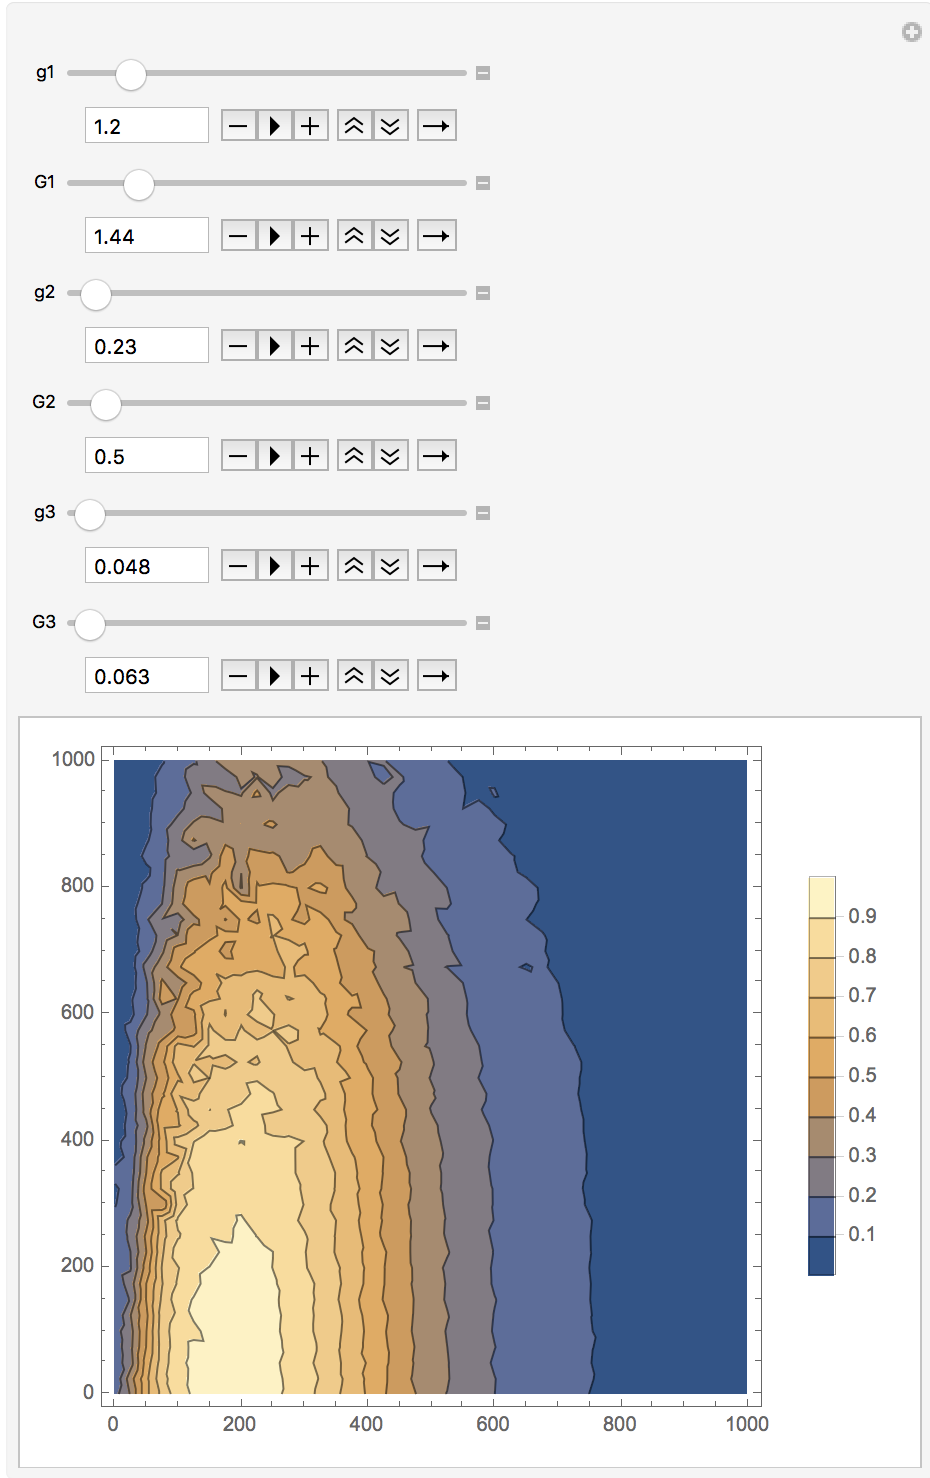
DynamicModule[{position, max, point}, 
 Manipulate[
  position = 
   Last@Ordering[(utl[#[[3]], g1, G1]*utl[#[[4]], g2, G2]*
         utl[#[[5]], g3, G3]) & /@ data]; 
  max = (utl[#[[3]], g1, G1]*utl[#[[4]], g2, G2]*
       utl[#[[5]], g3, G3]) &@data[[position]]; 
  point = data[[position, {1, 2}]]; 
  ListContourPlot[{#[[1]], #[[2]], 
      utl[#[[3]], g1, G1]*utl[#[[4]], g2, G2]*utl[#[[5]], g3, G3]} & /@
     data, PlotLegends -> Automatic, 
   Epilog -> {PointSize[Medium], Red, Point[point]}, 
   PlotLabel -> 
    StringTemplate["Maximum is `` at ``"][ToString[max], 
     ToString[point]]], {{g1, 1.2}, 0.001, 10, 0.001}, {{G1, 1.44}, 
   0.01, 10, 0.001}, {{g2, 0.23}, 0.001, 10, 0.001}, {{G2, 0.5}, 0.01,
    10, 0.001}, {{g3, 0.048}, 0.001, 10, 0.001}, {{G3, 0.063}, 0.01, 
   10, 0.001}]]

enter image description here

$\endgroup$

Your Answer

By clicking “Post Your Answer”, you agree to our terms of service and acknowledge you have read our privacy policy.

Not the answer you're looking for? Browse other questions tagged or ask your own question.