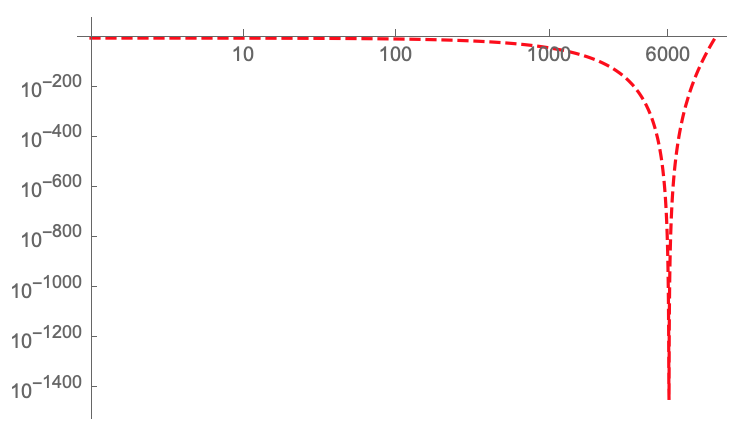
I'm trying to plot this function, but probably since the numbers are really small it shows a fake plot in log log scale. Is there a way to solve this problem?
LogLogPlot[499*(6000 - x)^498/6000^499, {x, 1, 9000},
 PlotRange -> {{1, 7000}, Automatic}, PlotStyle -> {Red, Dashed},
 Ticks -> {{10, 100, 1000, 6000}, Automatic}]
The hump near 6000 doesn't exist


PlotRange -> {{1, 7000}, All}to show the full range of values. To prevent it from showing any errors, you can usePlotRange->{{1, 7000}, {10^-1000, 1}}(otherwise, it tries to plot0atx=6000which will obviously not work) $\endgroup$LogLogPlot[499*(6000 - x)^498/6000^499, {x, 1, 9000}, PlotRange -> {{1, 7000}, {10^-1000, 1}}, PlotStyle -> {Red, Dashed}, Ticks -> {{10, 100, 1000, 6000}, Automatic}]: Image $\endgroup$