1
$\begingroup$

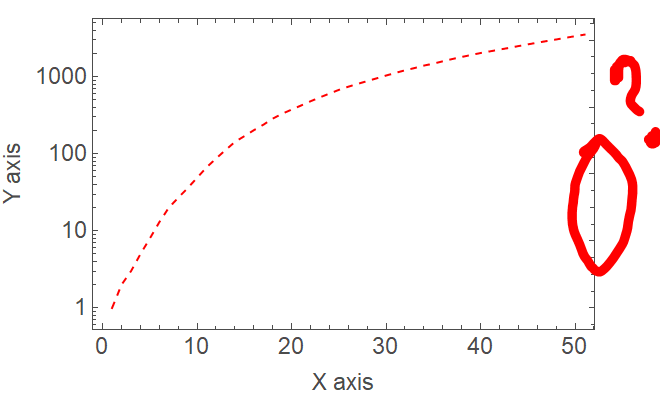
I am using ListLinePlot[] with ScalingFunctions->{None,"Log"} to get a log scale on the Y axis, and a frame. But the ticks on the right side of the log axis seem to be on a linear scale. How could I have both sides show log-scaled tick marks?

L={1, 2, 3, 5, 8, 13, 20, 27, 36, 49, 67, 87, 112, 143, 170, 203, 239, 
  287, 332, 376, 425, 482, 542, 607, 678, 745, 812, 882, 957, 1040, 
  1126, 1216, 1301, 1400, 1485, 1592, 1705, 1811, 1925, 2040, 2144, 
  2259, 2375, 2508, 2641, 2778, 2915, 3059, 3215, 3374, 3534};

ListLinePlot[L, Frame -> True, PlotRange -> Full, 
 FrameStyle -> Directive[RGBColor[0.3, 0.3, 0.3], 14], 
 PlotStyle -> Directive[Red, Dashed],
 FrameLabel -> {"X axis", "Y axis"},
 ScalingFunctions -> {None, "Log"}]

enter image description here

I am using MMA 12.1 in Windows 10.

Thanks!

$\endgroup$

1 Answer 1

6
$\begingroup$

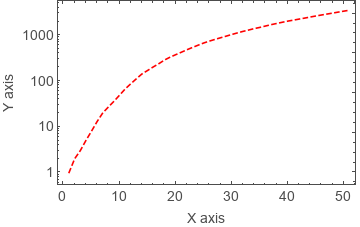
This seems to be a version 12.0+ glitch. Your code works as expected in version 11.3.

llp = ListLinePlot[L, Frame -> True, PlotRange -> Full, 
    FrameStyle -> Directive[RGBColor[0.3, 0.3, 0.3], 14], 
    PlotStyle -> Directive[Red, Dashed], 
    FrameLabel -> {"X axis", "Y axis"}, 
    ScalingFunctions -> {None, "Log"}]

enter image description here

The issue is caused by the default setting for FrameTicks:

FrameTicks /. llp[[2]]
    {{Quiet[Charting`ScaledTicks[{Log, Exp}][#1, #2, {6, 6}]] &, 
      Charting`ScaledFrameTicks[{Identity, Identity}]}, 
    {Automatic, Automatic}}

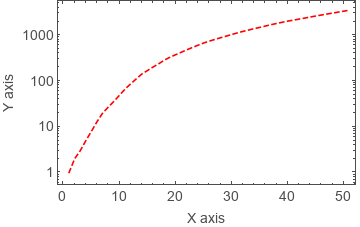
A simple work-around is to post-process to replace {Identity, Identity} with {Log, Exp}:

 llp /. {Identity, Identity} -> {Log, Exp}

enter image description here

$\endgroup$

Your Answer

By clicking “Post Your Answer”, you agree to our terms of service and acknowledge you have read our privacy policy.

Not the answer you're looking for? Browse other questions tagged or ask your own question.