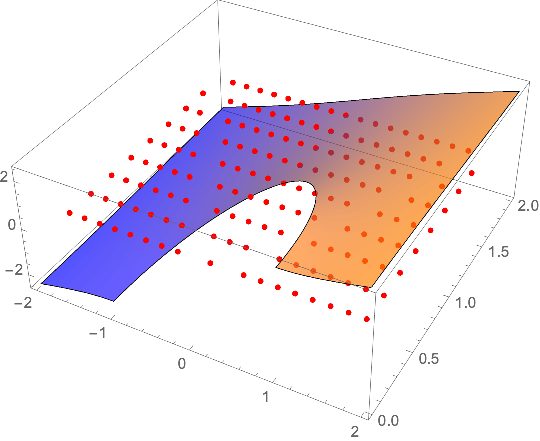
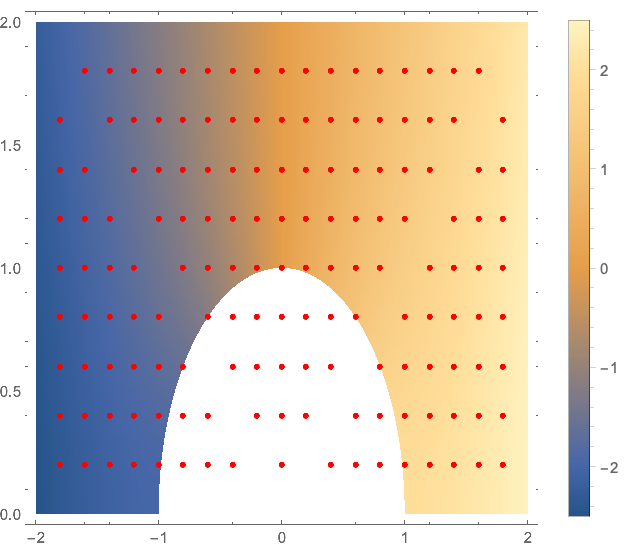
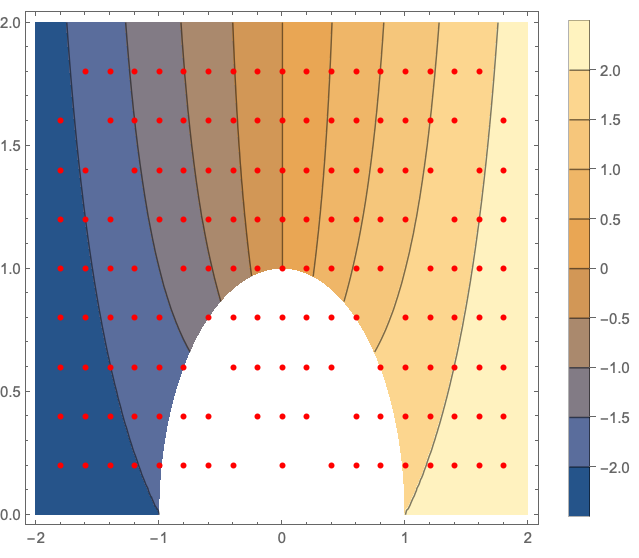
I have the following function f[x,y] and I figured out how to plot it to a specified domain, that you can observe in the code, but only in plot3D form I am trying to convert it to just a 2D graph. In my first line of code you can see that I tried to define domain in the function command itself but it did not work, it would only work with the plot3D command for some reason.
f[x_, y_] :=
x + (x/((x^2) + (y^2))) /; -2 <= x <= 2 && 0 <= y <= 2 &&
x^2 + y^2 >= 1;
Plot3D[f[x, y] && x^2 + y^2 >= 1, {x, -2, 2}, {y, 0, 2},
PlotPoints -> 100, Mesh -> None]
Next I have the points listed below that I need to plot onto the domain and graph specified above. It is supposed to look like a partially obstructed channel with nearly uniform grid in x and y direction (fluid flow).
pnts = {{-1.8, 0.2}, {-1.8, 0.4}, {-1.8, 0.6}, {-1.8, 0.8}, {-1.8,
1.}, {-1.8, 1.2}, {-1.8, 1.4}, {-1.8, 1.6}, {-1.6, 0.2}, {-1.6,
0.4}, {-1.6, 0.6}, {-1.6, 0.8}, {-1.6, 1.}, {-1.6, 1.2}, {-1.6,
1.4}, {-1.6, 1.8}, {-1.4, 0.2}, {-1.4, 0.4}, {-1.4, 0.6}, {-1.4,
0.8}, {-1.4, 1.}, {-1.4, 1.2}, {-1.4, 1.6}, {-1.4, 1.8}, {-1.2,
0.2}, {-1.2, 0.4}, {-1.2, 0.6}, {-1.2, 0.8}, {-1.2, 1.}, {-1.2,
1.4}, {-1.2, 1.6}, {-1.2, 1.8}, {-1., 0.2}, {-1., 0.4}, {-1.,
0.6}, {-1., 0.8}, {-1., 1.2}, {-1., 1.4}, {-1., 1.6}, {-1.,
1.8}, {-0.8, 0.2}, {-0.8, 0.4}, {-0.8, 0.6}, {-0.8, 1.}, {-0.8,
1.2}, {-0.8, 1.4}, {-0.8, 1.6}, {-0.8, 1.8}, {-0.6, 0.2}, {-0.6,
0.4}, {-0.6, 0.8}, {-0.6, 1.}, {-0.6, 1.2}, {-0.6, 1.4}, {-0.6,
1.6}, {-0.6, 1.8}, {-0.4, 0.2}, {-0.4, 0.6}, {-0.4, 0.8}, {-0.4,
 1.}, {-0.4, 1.2}, {-0.4, 1.4}, {-0.4, 1.6}, {-0.4, 1.8}, {-0.2,
0.4}, {-0.2, 0.6}, {-0.2, 0.8}, {-0.2, 1.}, {-0.2, 1.2}, {-0.2,
1.4}, {-0.2, 1.6}, {-0.2, 1.8}, {0., 0.2}, {0., 0.4}, {0.,
0.6}, {0., 0.8}, {0., 1.}, {0., 1.2}, {0., 1.4}, {0., 1.6}, {0.,
1.8}, {0.2, 0.4}, {0.2, 0.6}, {0.2, 0.8}, {0.2, 1.}, {0.2,
1.2}, {0.2, 1.4}, {0.2, 1.6}, {0.2, 1.8}, {0.4, 0.2}, {0.4,
0.6}, {0.4, 0.8}, {0.4, 1.}, {0.4, 1.2}, {0.4, 1.4}, {0.4,
1.6}, {0.4, 1.8}, {0.6, 0.2}, {0.6, 0.4}, {0.6, 0.8}, {0.6,
1.}, {0.6, 1.2}, {0.6, 1.4}, {0.6, 1.6}, {0.6, 1.8}, {0.8,
0.2}, {0.8, 0.4}, {0.8, 0.6}, {0.8, 1.}, {0.8, 1.2}, {0.8,
1.4}, {0.8, 1.6}, {0.8, 1.8}, {1., 0.2}, {1., 0.4}, {1.,
0.6}, {1., 0.8}, {1., 1.2}, {1., 1.4}, {1., 1.6}, {1., 1.8}, {1.2,
 0.2}, {1.2, 0.4}, {1.2, 0.6}, {1.2, 0.8}, {1.2, 1.}, {1.2,
1.4}, {1.2, 1.6}, {1.2, 1.8}, {1.4, 0.2}, {1.4, 0.4}, {1.4,
0.6}, {1.4, 0.8}, {1.4, 1.}, {1.4, 1.2}, {1.4, 1.6}, {1.4,
1.8}, {1.6, 0.2}, {1.6, 0.4}, {1.6, 0.6}, {1.6, 0.8}, {1.6,
1.}, {1.6, 1.2}, {1.6, 1.4}, {1.6, 1.8}, {1.8, 0.2}, {1.8,
0.4}, {1.8, 0.6}, {1.8, 0.8}, {1.8, 1.}, {1.8, 1.2}, {1.8,
1.4}, {1.8, 1.6}};


h[x_, y_] := x + (x/((x^2) + (y^2))); Plot3D[h[x, y], {x, -2, 2}, {y, 0, 2}, Mesh -> None, RegionFunction -> (#^2 + #2^2 >= 1 &)]and, perhaps,Show[DensityPlot[h[x, y], {x, -2, 2}, {y, 0, 2}, Mesh -> None, RegionFunction -> (#^2 + #2^2 >= 1 &)], ListPlot[pnts]]? $\endgroup$