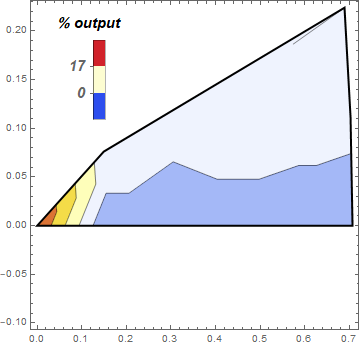
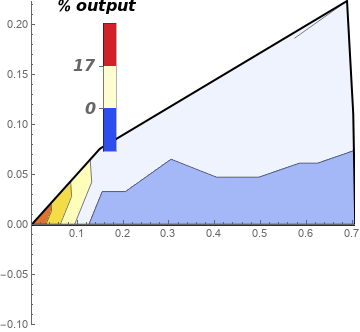
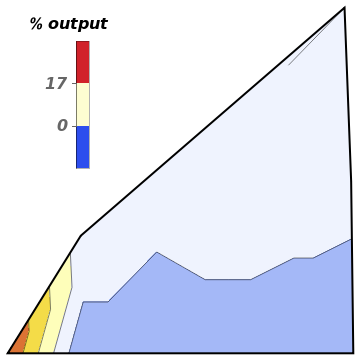
When I am trying to use PlotRangePadding with a fixed range (not symmetric with x and y axes) for a graphic generated by ListContourPlot, it is coming back with an error message that PlotRangePadding can only be either automatic or none.
Following is a small code to demonstrate the problem. Here, I want a padding at the bottom only, not a symmetric one around the whole graphic.
Will be thankful for any suggestion.
XX={{0.,0.,14},{0.,0.,2},{0.149508,0.076178,7},{0.153488,0.0498713,7},{0.156435,0.,4},{0.302952,0.0984348,7},{0.309017,0.,4},{0.444473,0.144418,7},{0.451668,0.0715374,7},{0.453991,0.,4},{0.574342,0.186615,8},{0.584501,0.0925761,7},{0.587786,0.,4},{0.689152,0.223919,8},{0.702713,0.111299,7},{0.707107,0.,4}};
    ListContourPlot[XX,ColorFunction->"TemperatureMap",PlotLegends->Placed[BarLegend[{0, 17, 34, 51, 67},LegendMargins->{{0,0},{10,5}},LegendLabel->"% output",LegendMarkerSize->150, LabelStyle->{Italic,Bold, FontSize->15, FontFamily->"Helvetica"}],{{0.1, 0.5}, {0.1, 0.1}}],PlotRangePadding->{{0, 0}, {0.1, 0}}, Frame -> False, BoundaryStyle->{Black, Thick}]


