1
$\begingroup$

I have a list as shown below:

m01 = {{250, 0.083121}, {200, 0.0888446}, {150, 0.0992422}, {100, 0.121567}, {50, 0.186825}}

I'm new to Mathematica, and would like to know how can I do these jobs:

1- How can I can plot it with ListPlot and make minimal formations on it?

2- How do I fit a curve on it? Witch command I use? How to put the curve plot together with the points?

$\endgroup$
5
  • 2
    $\begingroup$ try opening the docs and typing "best fit" (and follow the trail) $\endgroup$
    – acl
    Commented Mar 6, 2013 at 21:31
  • 4
    $\begingroup$ This is not a free consultancy service. You have to demonstrate that you expended some of your own effort before people are likely to help you. $\endgroup$ Commented Mar 6, 2013 at 21:40
  • $\begingroup$ I tried to make some changes in the question to make it more generic. I think that now It's a good questions for new users (I remember me having this problems when I started use MMA). $\endgroup$
    – Murta
    Commented Mar 7, 2013 at 11:04
  • $\begingroup$ @Murta what do you mean "make minimal formations on it"? $\endgroup$
    – acl
    Commented Mar 7, 2013 at 12:53
  • $\begingroup$ Like add, title, colors, range and so on. I don't know if it was a good ask! .. Suggestions? :) $\endgroup$
    – Murta
    Commented Mar 7, 2013 at 14:53

2 Answers 2

7
$\begingroup$

There is one model.

m01 = {{250, 0.083121}, {200, 0.0888446}, {150, 0.0992422}, {100, 0.121567}, {50, 0.186825}};
model = LinearModelFit[m01, {x^-1}, x];

p2 = Plot[model@x, {x, 0, 250}, PlotStyle -> {Red, Thick}];
p1 = ListPlot[m01, PlotStyle -> {PointSize[.025]}];

Show[p2,p1
  ,PlotLabel -> Column[
     Style[#, Bold, 15]& /@ {"Adjusted R Squared", model["AdjustedRSquared"]}
     ,Alignment->Center]
  ,PlotRange -> {{0, 250}, All}
  ,AxesOrigin -> {0, 0}
  ,Frame -> True
  ,Epilog ->
    Inset[Style[Framed@Normal@model, Bold, 14], Scaled[{0.95, 0.95}], Scaled[{1, 1}]]
]

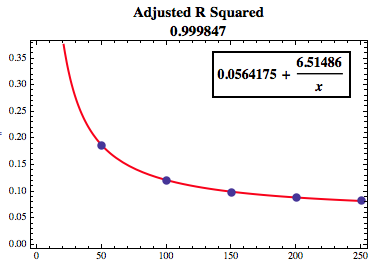
You get:

enter image description here

and it has a nice R2, too.

I hope it helps.

$\endgroup$
2
  • $\begingroup$ Thank you very much Murta. I tried FittedModel with exponential function. when I plot it with listplot, it was near the x axis. This is exactly what I want. Thanks a lot. $\endgroup$
    – TMH
    Commented Mar 6, 2013 at 21:45
  • $\begingroup$ Welcome to SE! I made some updates in the presentation form. Make good use. $\endgroup$
    – Murta
    Commented Mar 6, 2013 at 21:57
2
$\begingroup$

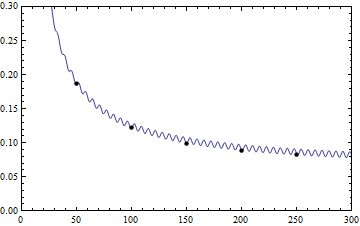
my curve is smooth too, and my R^2 is 0.999997

model = NonlinearModelFit[data, ( a/x + b + c Sin[x/d]), {a, {b, 25}, c, d}, {x}, 
        Method -> "LevenbergMarquardt", MaxIterations -> 10000]

Here is the plot (added by s0rce)

Mathematica graphics

$\endgroup$
9
  • $\begingroup$ Can you add a plot including the fit line? I'll upvote it, if you do. $\endgroup$
    – rcollyer
    Commented Mar 7, 2013 at 3:42
  • $\begingroup$ Either, create the plot, save it somewhere, and use the sixth button from the left in the edit window to bring up the file upload dialog. Or, you could use Szabolcs uploader. $\endgroup$
    – rcollyer
    Commented Mar 7, 2013 at 3:58
  • $\begingroup$ Why did you choose to add a sinusoidal compoenent to the fit? It is very small c = 0.00436027 and The adjusted R2 only increases from 0.999982 to 0.999997. Could you explain this to improve your answer? The oscillation seems odd. $\endgroup$
    – s0rce
    Commented Mar 7, 2013 at 4:01
  • $\begingroup$ I added the plot for you. $\endgroup$
    – s0rce
    Commented Mar 7, 2013 at 4:07
  • 2
    $\begingroup$ Well..this sin functions make no sense. To much parameters for a small number of points, it's a overfiting problem... If it's just for fun so ok. $\endgroup$
    – Murta
    Commented Mar 7, 2013 at 10:46

Not the answer you're looking for? Browse other questions tagged or ask your own question.