4
$\begingroup$

I am trying to make a 3D contour plot I calculated in c++. I read in the results as tables and used the function ListSliceContourPlot3D. Everything looks fine except on the top layers where some area has value zero.

For example, one layer with values

0 0 0 0 0 0 0 1 2 3 4 3 2 1 
0 0 0 0 0 0 1 2 3 4 5 4 3 2
0 0 0 0 0 1 2 3 4 5 6 5 4 3 
0 0 0 0 0 1 1 2 3 4 3 2 1 1
...

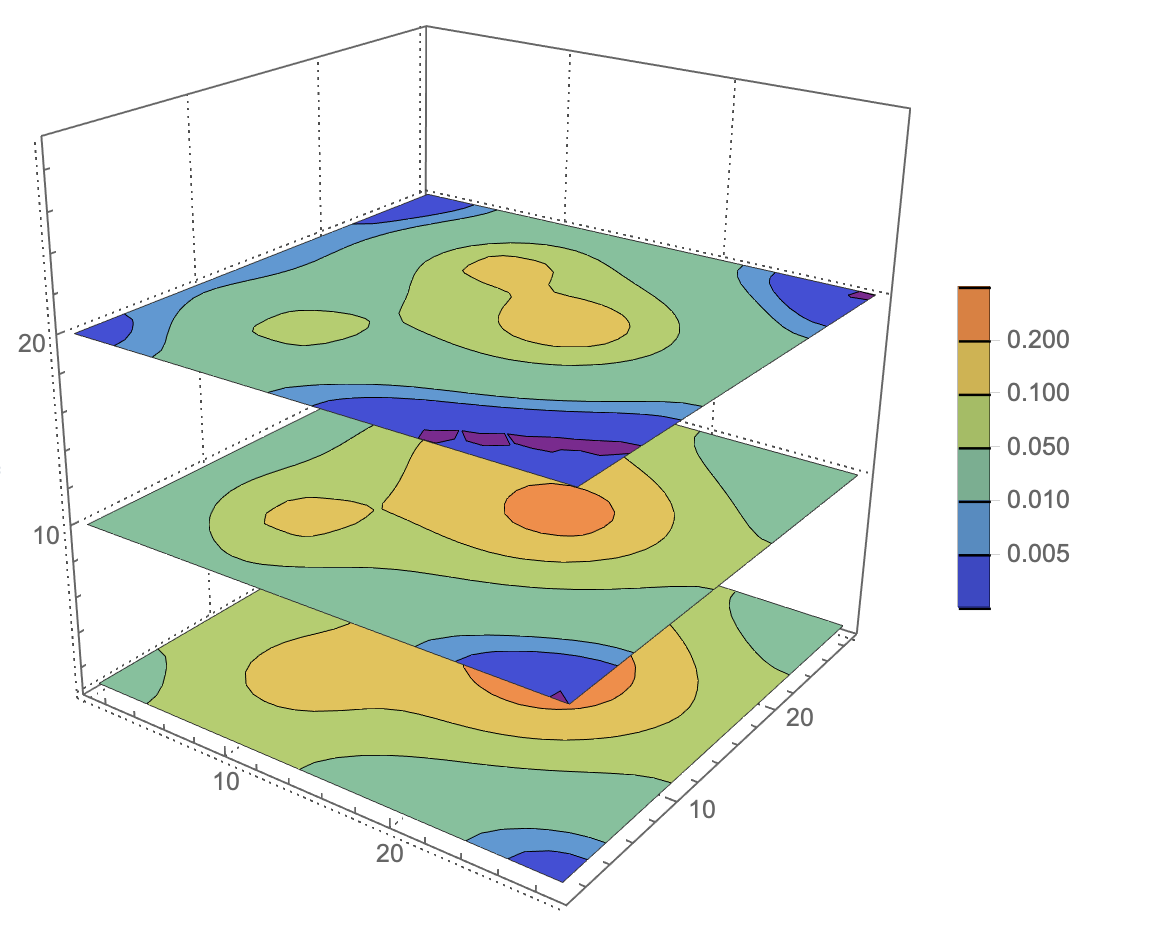
yields wired contour lines on the left corner.

To my understanding, there should not be any curve plotted there, not only because the numbers are zero but because they are the same.

Here is my data: data

Here is how I read in the data:

data = Import[".../data.txt", "table"];
dim = Dimensions[data];
l = dim[[1]]/dim[[2]]; m = dim[[2]]; n = dim[[2]];
cuboid = Table[1, {x, l}, {y, m}, {z, n}];
For[i = 1, i < l + 1, i++, a = n*(i - 1) + 1; b = n*i; 
 cuboid[[i]] = data[[a ;; b]]]

Here is how I make the contour plot:

ListSliceContourPlot3D[cuboid, {"ZStackedPlanes", {1, 10, 20}}, 
 PlotTheme -> "Detailed", ColorFunction -> "Rainbow", 
 Contours -> {0.05, 0.1, 0.2, 0.01, 0.005}, ContourStyle -> Black]

Here is a sample result:

How could I get ride of the purple area and its boundary curves?

$\endgroup$
6
  • 2
    $\begingroup$ I don't see the complete set of commands to construct any contour plot. It looks like the commands just before PlotTheme -> was not copied into the question. $\endgroup$
    – JimB
    Commented Oct 10, 2019 at 18:13
  • $\begingroup$ try the option PlotRange->{All, All, All, {-.5,.5}}? $\endgroup$
    – kglr
    Commented Oct 10, 2019 at 23:01
  • $\begingroup$ @kglr That seems to clear things up. But why a lower bound of -0.5 when there are no negative numbers in the data? $\endgroup$
    – JimB
    Commented Oct 11, 2019 at 2:04
  • $\begingroup$ @JimB, I did not have chance to look at the data.The suggestion {-.5,.5} was based on the contours list in OP; any pair of numbers that give an interval covering the contours list should do (I think). $\endgroup$
    – kglr
    Commented Oct 11, 2019 at 2:14
  • $\begingroup$ @kglr That solves the problem. Thanks for your help! $\endgroup$
    – Jun Liu
    Commented Oct 11, 2019 at 16:49

2 Answers 2

3
$\begingroup$

Use the fourth part of PlotRange setting to specify a range for the function value that covers your list of contours ({0.05, 0.1, 0.2, 0.01, 0.005}); for example,

PlotRange -> {All, All, All, {-.5,.5}}
$\endgroup$
1
$\begingroup$

This is a "guess" that might prompt someone to figure out the real answer.

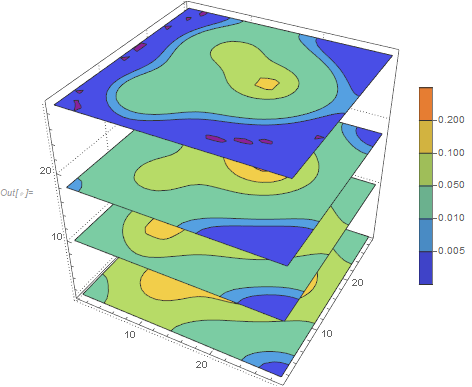
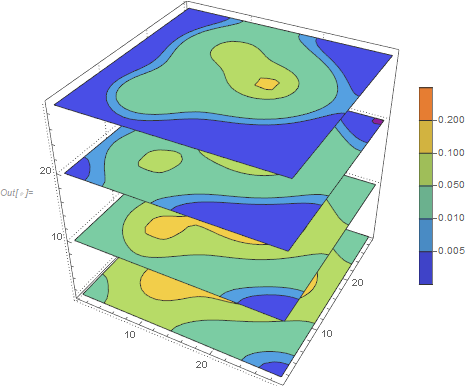
It appears that the individual contour slices (assuming ListSliceContourPlot3D is used) depend on what other contours are requested. Below are two examples. One asks for slices 1, 10, 18, and 29 and the other asks for slices 1, 10, 20, and 29.

ListSliceContourPlot3D[
 cuboid[[{1, 10, 18, 29}]], {"ZStackedPlanes", {1, 10, 18, 29}},
 PlotTheme -> "Detailed", ColorFunction -> "Rainbow",
 DataRange -> {{1, 29}, {1, 29}, {1, 29}},
 Contours -> {0.05, 0.1, 0.2, 0.01, 0.005}
 ]

Contour slices with 1, 10, 18, and 29

ListSliceContourPlot3D[
 cuboid[[{1, 10, 20, 29}]], {"ZStackedPlanes", {1, 10, 20, 29}},
 PlotTheme -> "Detailed", ColorFunction -> "Rainbow",
 DataRange -> {{1, 29}, {1, 29}, {1, 29}},
 Contours -> {0.05, 0.1, 0.2, 0.01, 0.005}
 ]

Contour slices with 1, 10, 20, and 29

So until one figures out how to control the "vertical" interpolation, I don't think ListSliceContourPlot3D can do what you want.

$\endgroup$

Your Answer

By clicking “Post Your Answer”, you agree to our terms of service and acknowledge you have read our privacy policy.

Not the answer you're looking for? Browse other questions tagged or ask your own question.