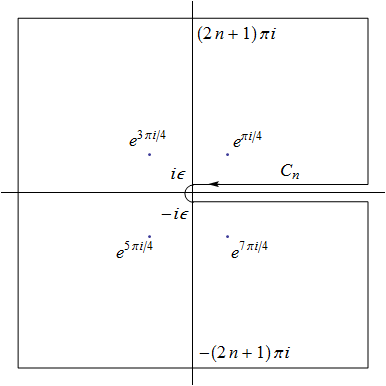
This answer at Math.SE contains a neat contour diagram created using Mathematica:

What Mathematica functions I can use to draw diagrams like this?
This answer at Math.SE contains a neat contour diagram created using Mathematica:

What Mathematica functions I can use to draw diagrams like this?
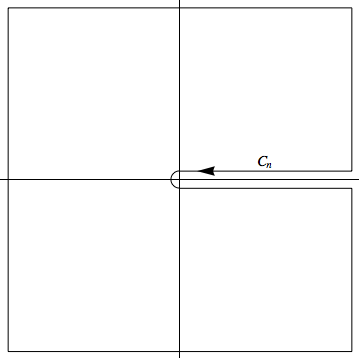
Here's a quick 5 minute reproduction of the diagram (I've left the labeling of individual points out):

With[{ε = 0.05, L = 1, thick = AbsoluteThickness[1]},
    Graphics[{
        thick,
        Circle[{0, 0}, ε, {π/2, 3 π/2}],
        Arrowheads[{{0.05, 0.99}}],
        Arrow[{{0, -ε}, {L, -ε}, {L, -L}, {-L, -L}, {-L, L}, {L, L}, {L, ε}, {0, ε}}],
        Text[Style["\!\(\*SubscriptBox[\(C\), \(n\)]\)", FontSize -> 15], {L/2, 0.1}]
    }, Axes -> True, AxesStyle -> thick, Ticks -> False]
]
The key points to make life simple are:
Arrow chain for the entire length.Arrowheads to specify the position of the arrow head.AbsoluteThickness to get a uniform thickness. Circle to draw arcs. Graphics[{Circle[{0, 0}, 1, Pi/2 {1, 3}],
Arrow[{{10, 1}, {0, 1}}],
Line[{{0, 1}, {10, 1}, {10, 10}, {-10, 10}, {-10, -10}, {10, -10}, {10, -1}, {0, -1}}]},
Axes -> True, Ticks -> None]

One can use Arrow as following.
pts = {{0, -1}, {10, -1}, {10, -10}, {-10, -10}, {-10, 10}, {10, 10}, {10, 1}};
Graphics[{Circle[{0, 0}, 1, Pi/2 {1, 3}], Arrowheads[{0, 0.03, 0}],
  Arrow[{{10, 1}, {0, 1}}], Arrow[Partition[pts, 2, 1]]},
 Axes -> True, AxesStyle -> AbsoluteThickness@1, Ticks -> None]
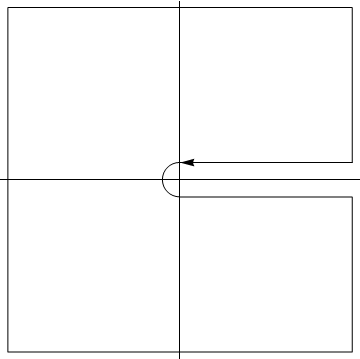
And replace Arrowheads[{0, 0.03, 0}] to Arrowheads[{0, 0.03, 0.03, 0}] to get
Line,ArrowandCircleinsideGraphics; alsoPointandText. I imagine the contour was done "by hand", so to speak, inserting appropriate coordinates. $\endgroup$