0
$\begingroup$

I am trying to find a model with a Fourier basis for this data:

data = {{1, -0.5}, {2, -15}, {3, 30}, {4, 184.25}, {5, 
    2143.75}, {6, 6234.75}, {7, 11969.75}, {8, 16940.75}, {9, 
    20484.75}, {10, 23084.25}, {11, 24577.25}, {12, 26321.75}, {13, 
    29709.25}, {14, 36357.75}, {15, 40502.25}, {16, 38244.25}, {17, 
    30486.25}, {18, 19492.75}, {19, 13318.25}, {20, 12267.25}, {21, 
    12376.25}, {22, 12375.75}, {23, 12376.25}, {24, 12376.25}};

Help is greatly appreciated thanks!

$\endgroup$
3
  • $\begingroup$ Can you post some actual code with the data to make it easier to copy and paste? You will find more easily help this way. Also, can you show us what you've tried so far and how it fails? Some will (hopefully) also post a link with a proper welcome - I would do it but I don't remember the appropriate link. $\endgroup$
    – user49048
    Commented Oct 2, 2019 at 10:18
  • $\begingroup$ Possible duplicate of "Find a Fourier series from discrete data" . $\endgroup$ Commented Oct 2, 2019 at 14:11
  • $\begingroup$ Another possible duplicate "Fourier Transform to help guess with NonLinearModelFit". $\endgroup$ Commented Oct 2, 2019 at 14:41

2 Answers 2

1
$\begingroup$

Is this what you wanted?

data = {{1, -0.5}, {2, -15}, {3, 30}, {4, 184.25}, {5, 
    2143.75}, {6, 6234.75}, {7, 11969.75}, {8, 16940.75}, {9, 
    20484.75}, {10, 23084.25}, {11, 24577.25}, {12, 26321.75}, {13, 
    29709.25}, {14, 36357.75}, {15, 40502.25}, {16, 38244.25}, {17, 
    30486.25}, {18, 19492.75}, {19, 13318.25}, {20, 12267.25}, {21, 
    12376.25}, {22, 12375.75}, {23, 12376.25}, {24, 12376.25}};

lm = LinearModelFit[data, x, x]

The answer is

FittedModel[7583.2 +732.805 x]

If yes, then you can read more about it here LinearModelFit

$\endgroup$
1
$\begingroup$

Although I think that this question is a duplicate of others (for example, this and this) it seems that applying the suggestions/code from those answers is not direct or trivial.

Here is a solution which I found with QRMon but redressed it as a NonlinearModelFit one.

bFuncs = Join[Table[Sin[i x/20], {i, 1, 60, 2}], Table[Cos[i x/20], {i, 0, 20, 2}]];

bs = Array[b, Length[bFuncs]];

nlm = NonlinearModelFit[data, bs.bFuncs, bs, x]

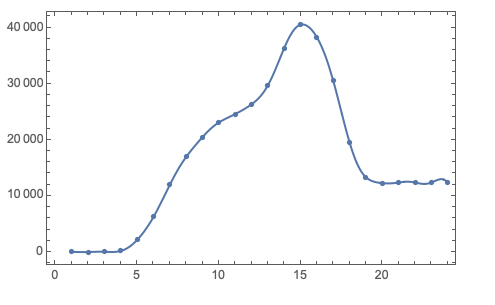
Show[ListPlot[data], Plot[nlm[x], {x, Min[data[[All, 1]]], Max[data[[All, 1]]]}], Frame -> True]

enter image description here

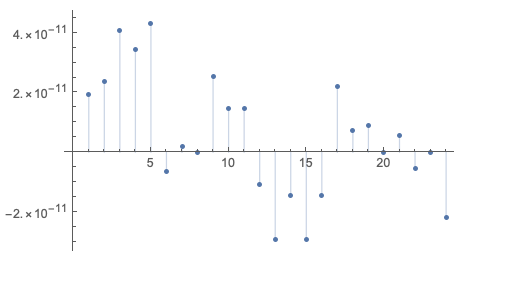
ListPlot[nlm["FitResiduals"], Filling -> Axis]

enter image description here

nlm["Function"][x]

(* 5669.1 + 1336.03 Cos[x/10] - 8003.44 Cos[x/5] - 
 2004.01 Cos[(3 x)/10] + 1462.08 Cos[(2 x)/5] + 1225.55 Cos[x/2] - 
 676.923 Cos[(3 x)/5] - 396.566 Cos[(7 x)/10] + 
 1900.68 Cos[(4 x)/5] + 164.913 Cos[(9 x)/10] - 1037.4 Cos[x] + 
 9867.23 Sin[x/20] + 8288.73 Sin[(3 x)/20] - 2577.54 Sin[x/4] - 
 3047.06 Sin[(7 x)/20] - 540.337 Sin[(9 x)/20] + 
 887.6 Sin[(11 x)/20] - 403.283 Sin[(13 x)/20] - 
 1435.52 Sin[(3 x)/4] + 1099.31 Sin[(17 x)/20] + 
 981.363 Sin[(19 x)/20] - 556.755 Sin[(21 x)/20] - 
 132.728 Sin[(23 x)/20] + 103.919 Sin[(5 x)/4] + 
 546.033 Sin[(27 x)/20] - 243.036 Sin[(29 x)/20] - 
 441.13 Sin[(31 x)/20] + 389.737 Sin[(33 x)/20] - 
 297.45 Sin[(7 x)/4] + 96.2562 Sin[(37 x)/20] + 
 285.294 Sin[(39 x)/20] - 343.174 Sin[(41 x)/20] + 
 194.906 Sin[(43 x)/20] - 74.1913 Sin[(9 x)/4] + 
 37.3024 Sin[(47 x)/20] + 108.943 Sin[(49 x)/20] - 
 308.276 Sin[(51 x)/20] + 337.058 Sin[(53 x)/20] - 
 127.753 Sin[(11 x)/4] + 87.3725 Sin[(57 x)/20] - 
 29.0636 Sin[(59 x)/20] *)
$\endgroup$

Your Answer

By clicking “Post Your Answer”, you agree to our terms of service and acknowledge you have read our privacy policy.

Not the answer you're looking for? Browse other questions tagged or ask your own question.