7
$\begingroup$

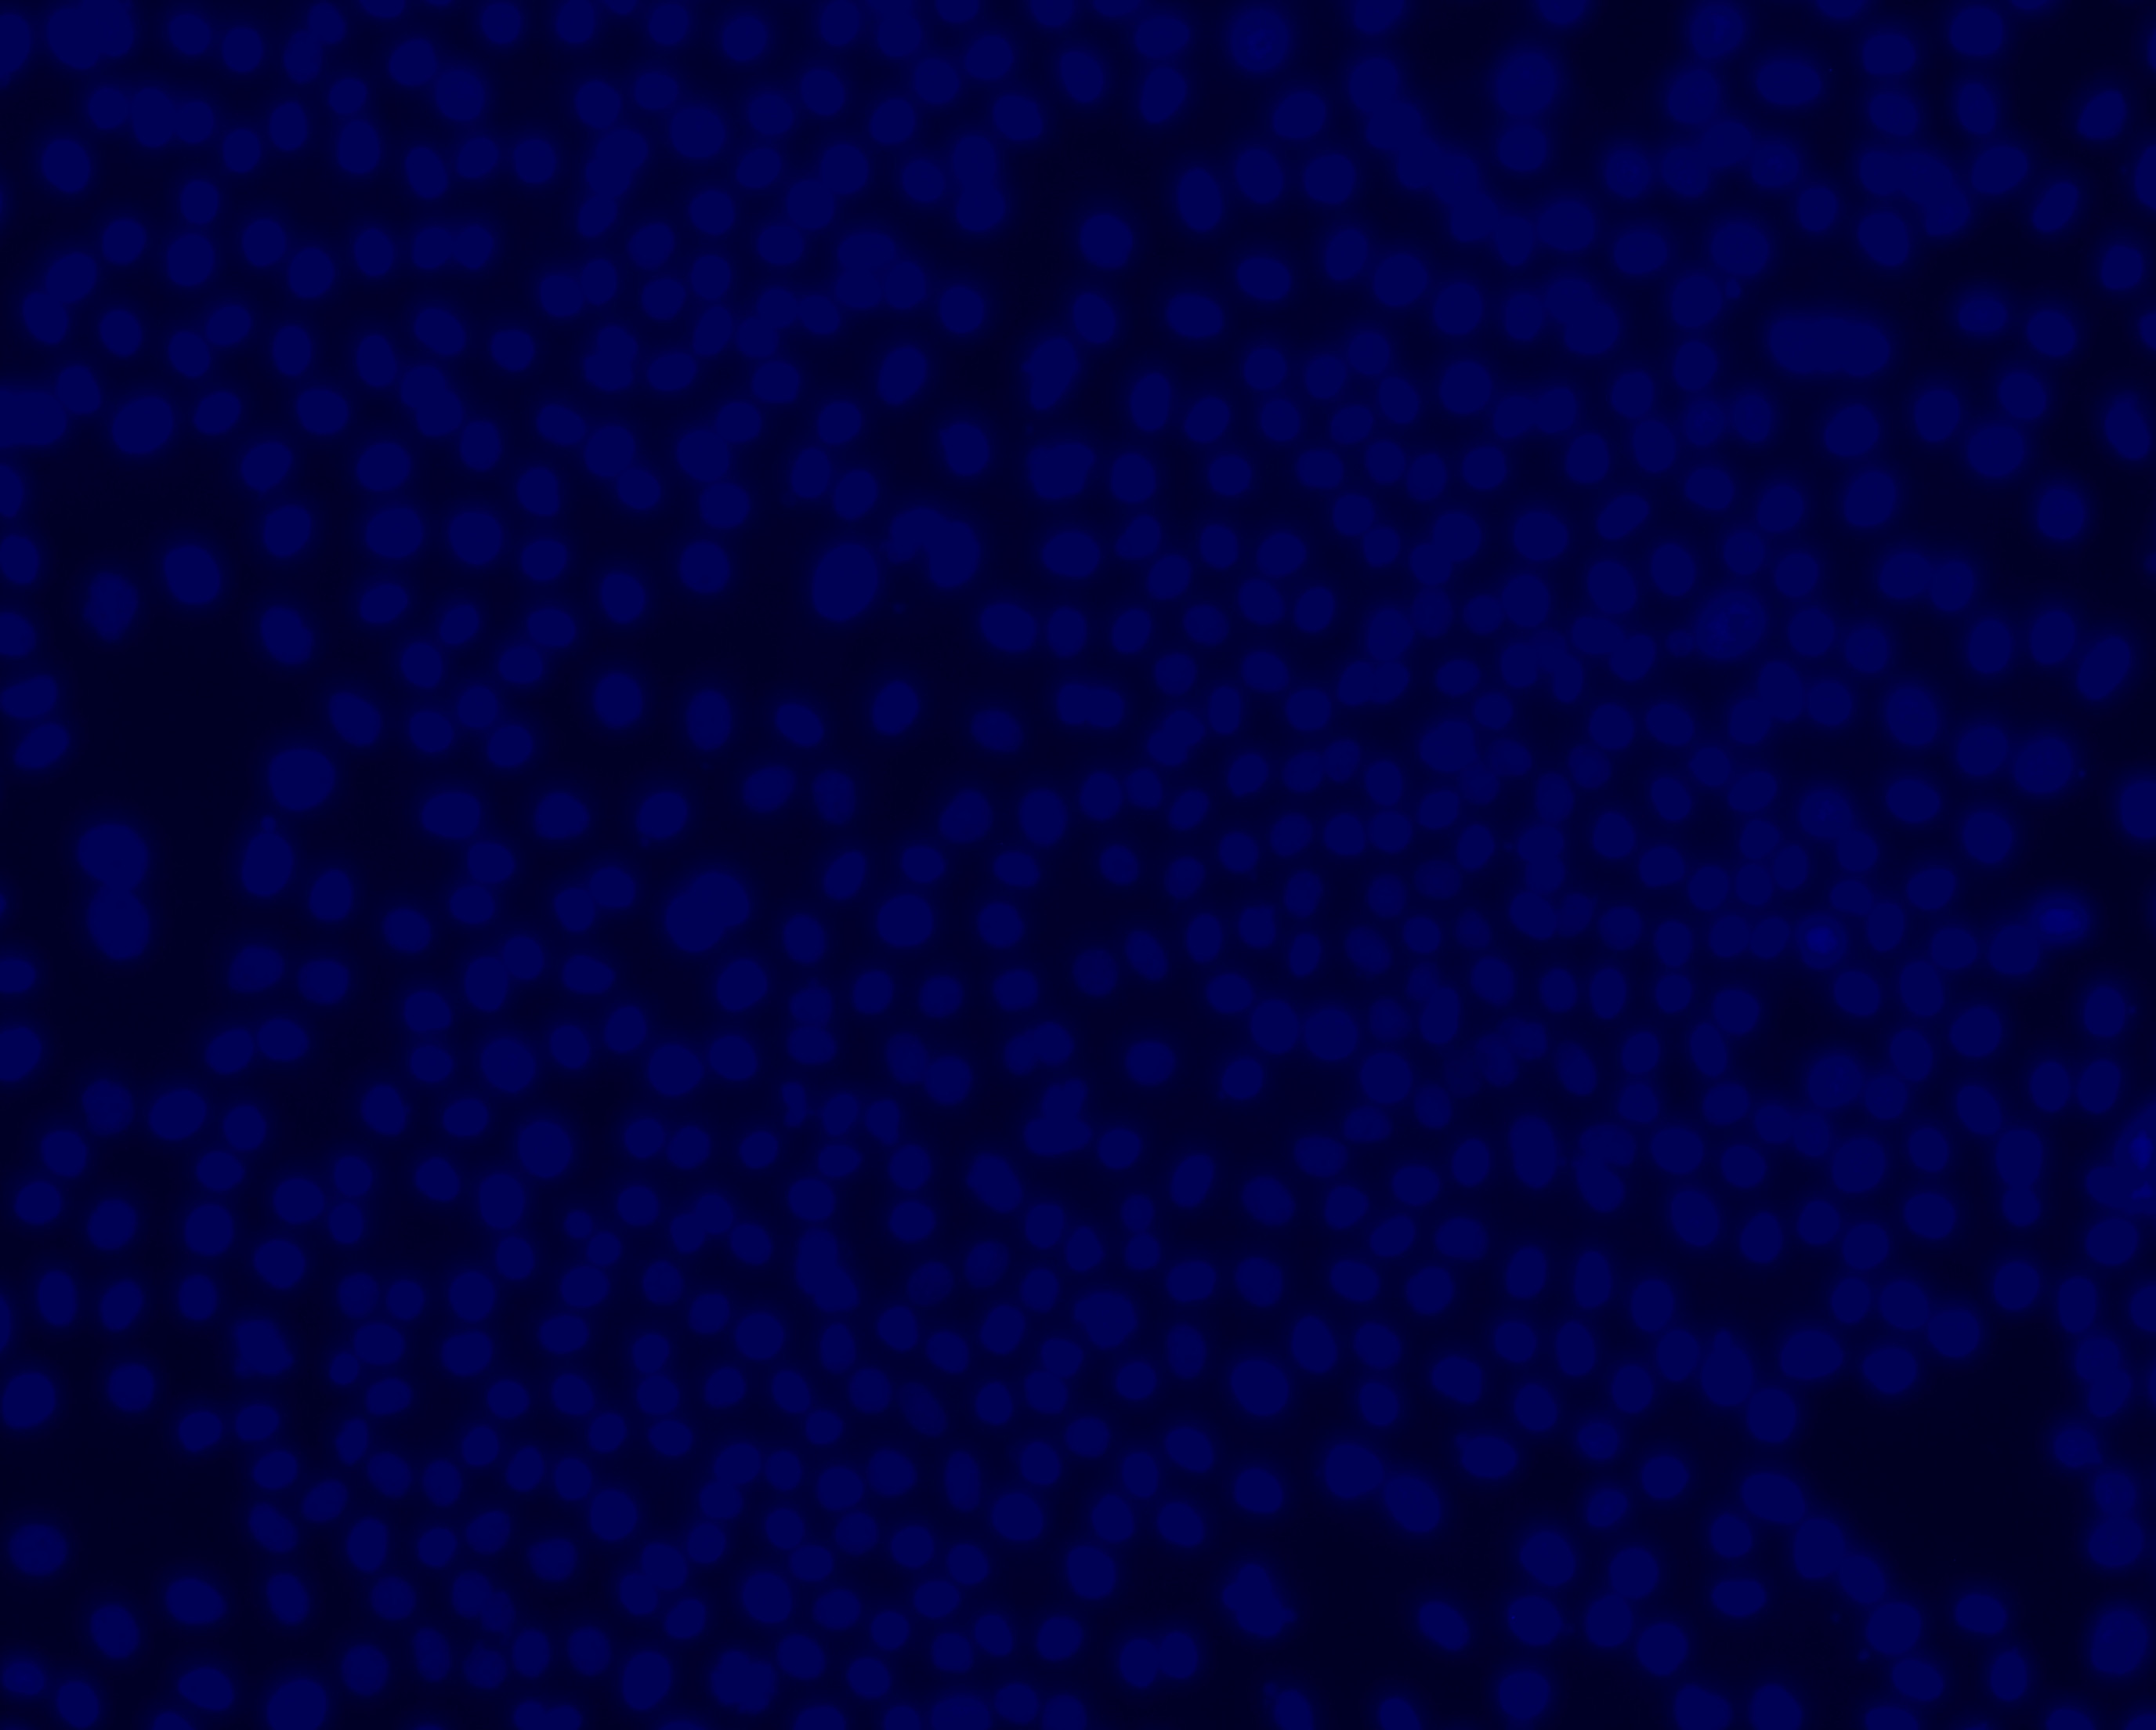
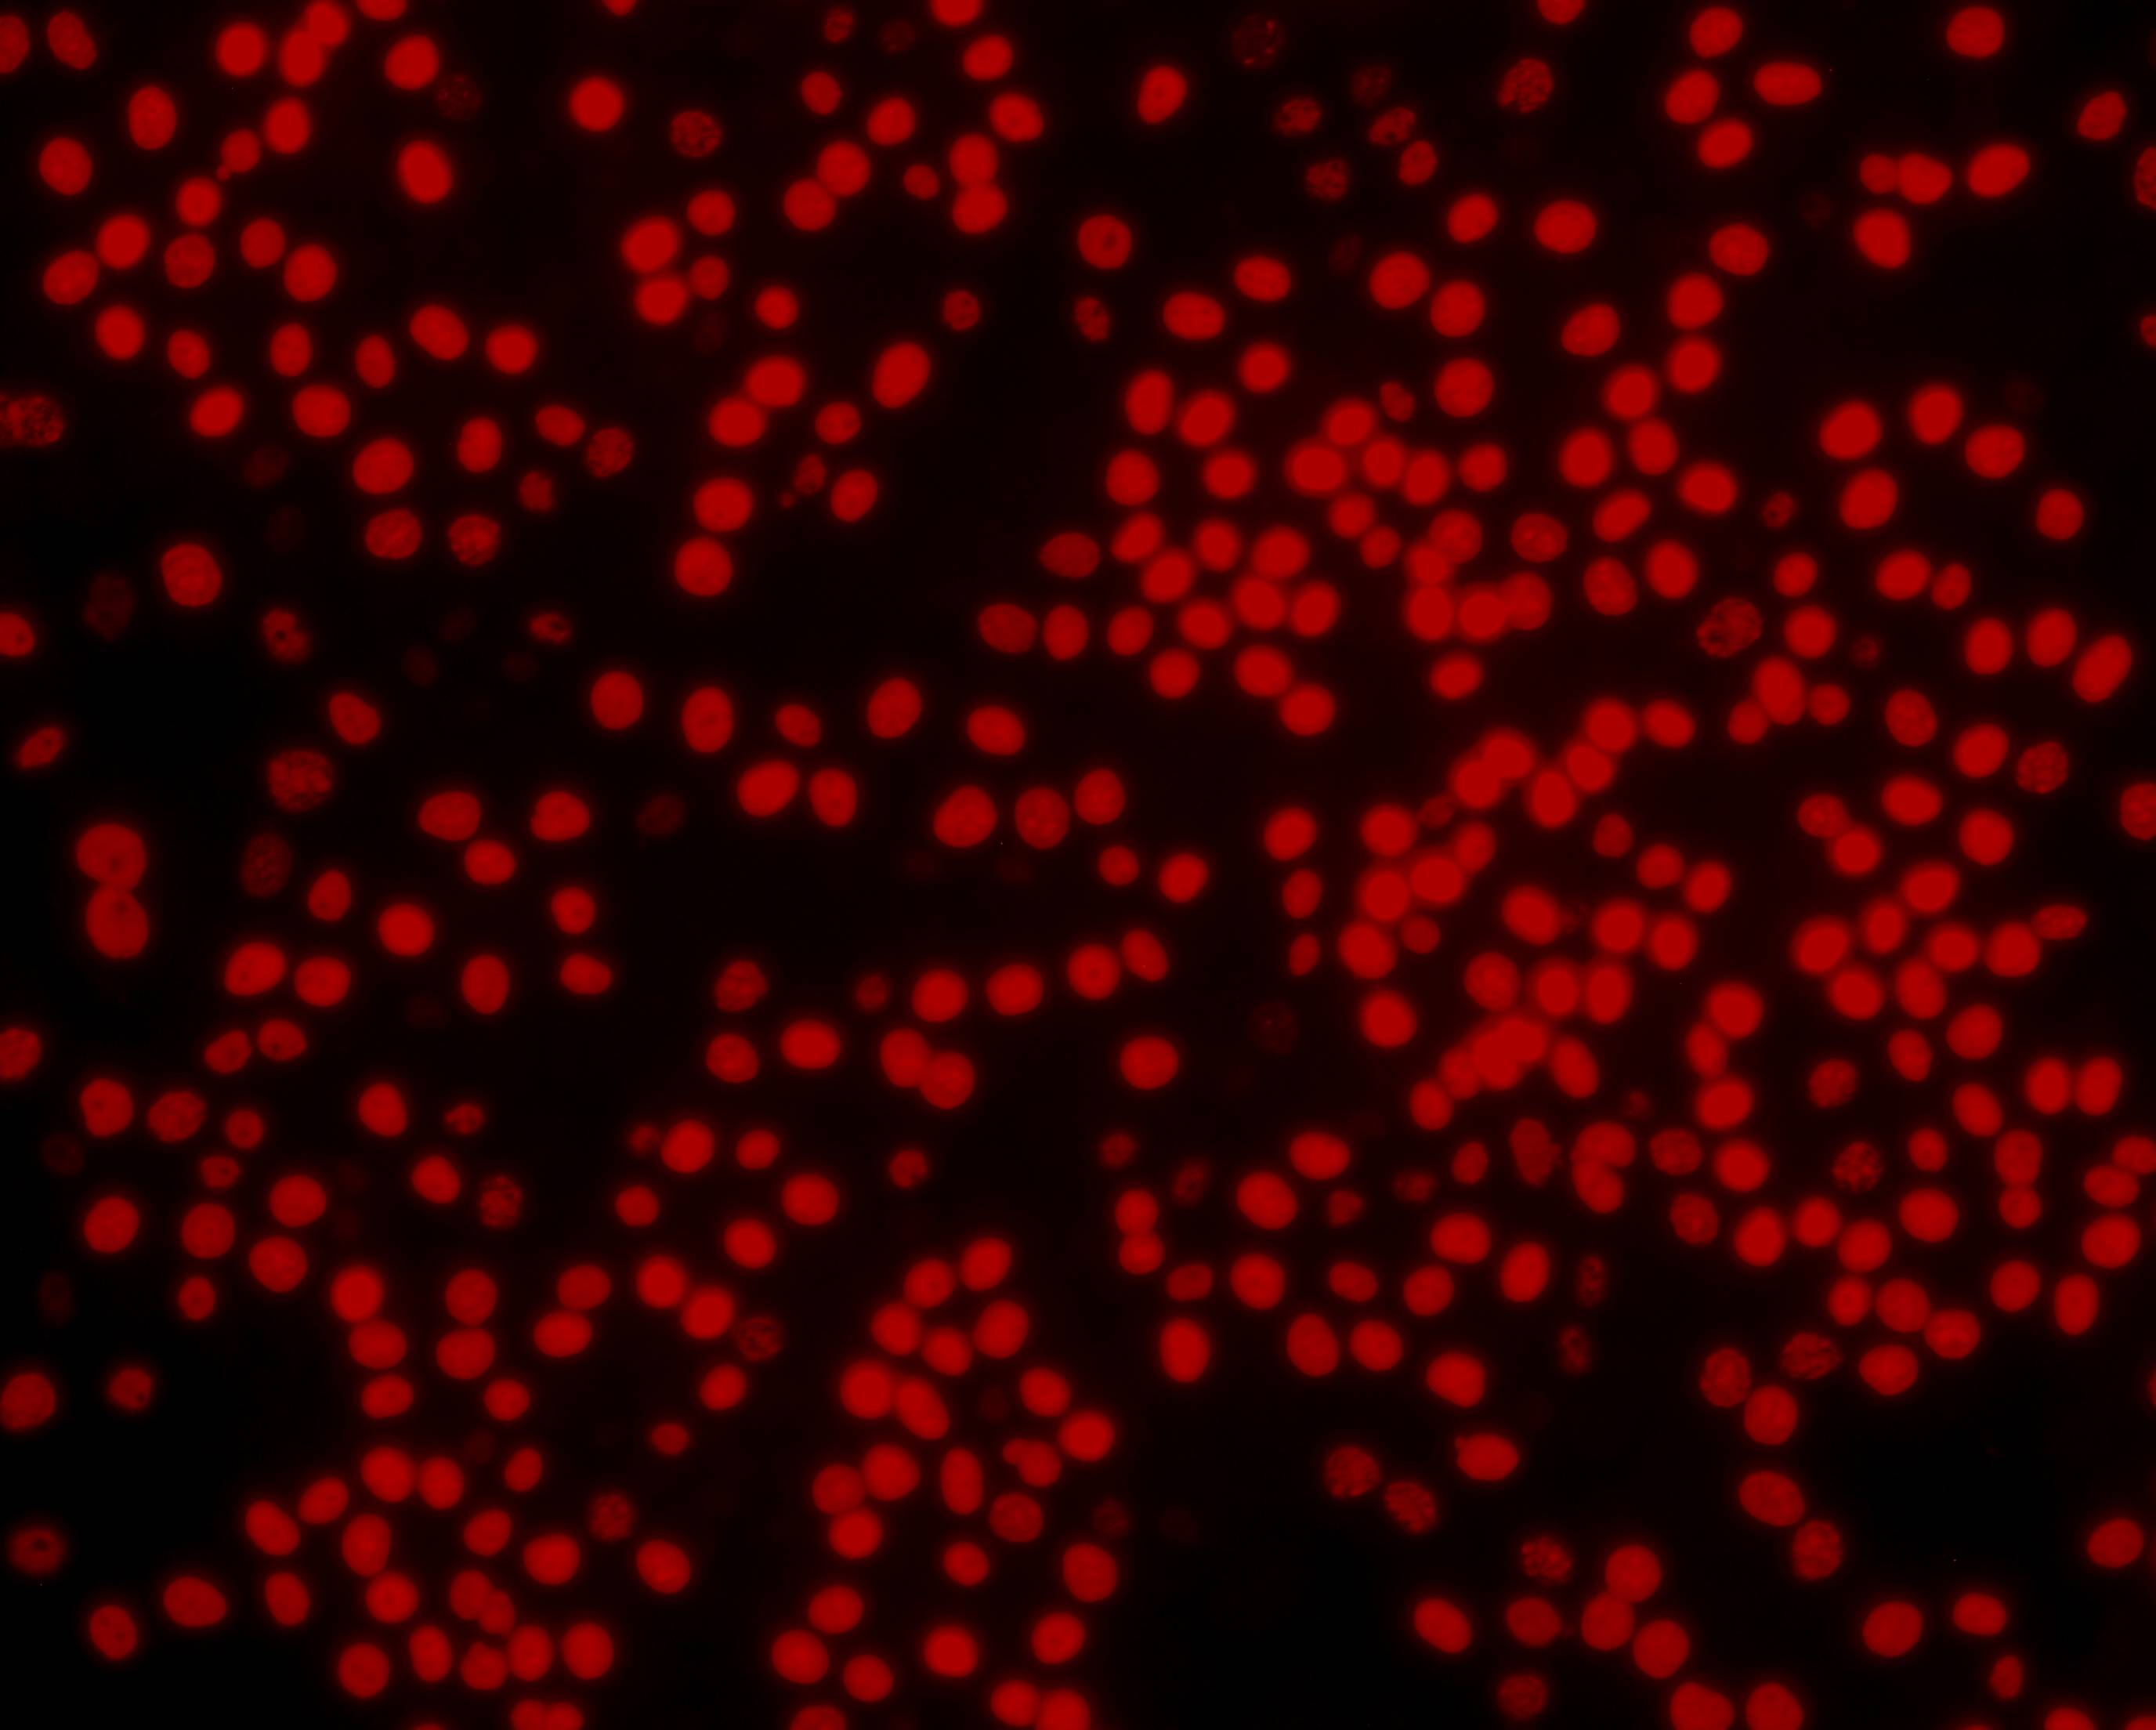
I have several picture containing many small circles. I can manually count the circles in these pictures but it will be time-consuming and make me tired. How can I use mathematica to do this job?

enter image description here enter image description here

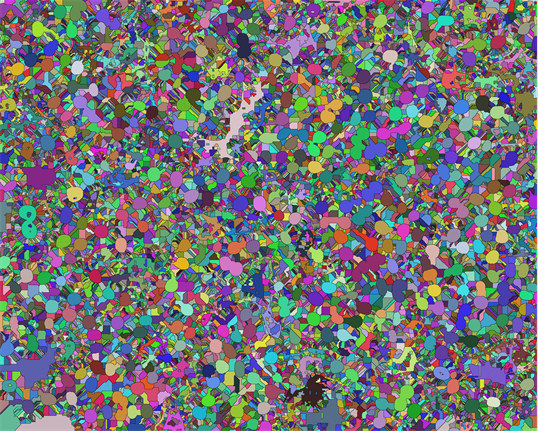
I have noticed that there is a post in this website dealing with the similar question. But when I use the code in that post, the final output is not satisfied, and some circles are not counted.

img = Import["https://i.sstatic.net/uNYIT.jpg"];
binimg = LocalAdaptiveBinarize[img, 25];
big = ImageDemosaic[binimg // ColorConvert[#, "Grayscale"] &, 
     "RGGB"] // MinDetect // SelectComponents[#, "Count", # > 100 &] &;
(array = WatershedComponents[GradientFilter[big, 2], 
    DistanceTransform[big] // MaxDetect]) // Colorize

The output for above code is enter image description here

$\endgroup$
1
  • $\begingroup$ Have you tried neural network approach? U-net seems worth a try. $\endgroup$
    – Silvia
    Commented Aug 8, 2019 at 11:14

4 Answers 4

5
$\begingroup$

You could try something like this.

I used ColorSeparate since I prefer to do quantifications with greyscale images. (I also resized your images to make it run faster on my old computer.)

img1 = ColorSeparate[ImageResize[firstimage, 1000]][[1]];

Rescaling the image levels from 0-1:

{img1, img1b = ImageAdjust[img1]}

enter image description here

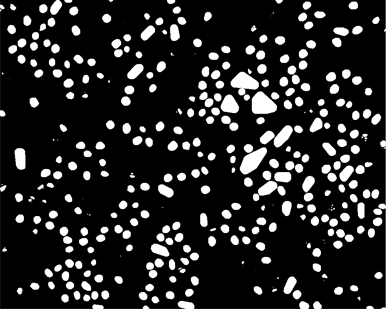
Detecting spots with MorphologicalComponents. (Unfortunately you have to play around with the background value - 0.7 in this example - to get good detection.)

spots = MorphologicalComponents[img1b, .7, Method -> "ConvexHull"];
Image[spots]

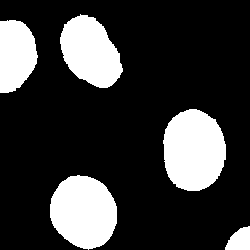
enter image description here

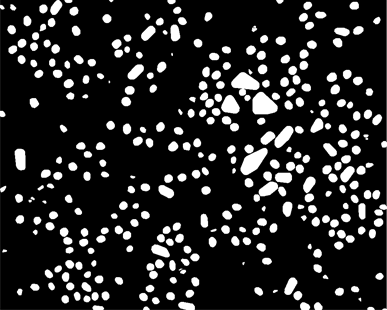
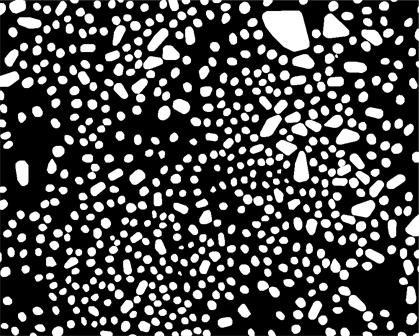
You may want to do some selection of spots based on size, for example weeding out spots of 20 pixels or less:

weededspots = SelectComponents[spots, "Count", # > 20 &];
Image[weededspots]

enter image description here

The number of detected spots can then be found in several ways, for example:

Length[ComponentMeasurements[weededspots, "Label"]]
 (* 329 *)

Length[Union[Flatten[weededspots]]] - 1
 (* 329 *)

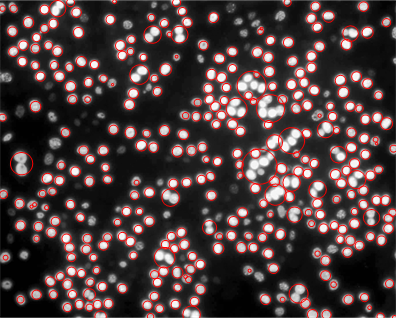
You can get an idea of how well (or poorly) it's working with something like:

Show[img1b, 
 Graphics[{Red, Circle[#[[1]], #[[2]]]}] & /@ 
  ComponentMeasurements[weededspots, {"Centroid", "BoundingDiskRadius"}][[All, 2]]]

enter image description here

You can see that some of the dim spots were not detected, and some of the closely-spaced spots are merged together in one blob. It may be possible to improve performance by preprocessing the image in a different way.

Here is the second image:

img2 = ColorSeparate[ImageResize[secondimage, 1000]][[1]];
img2b = ImageAdjust[img2];
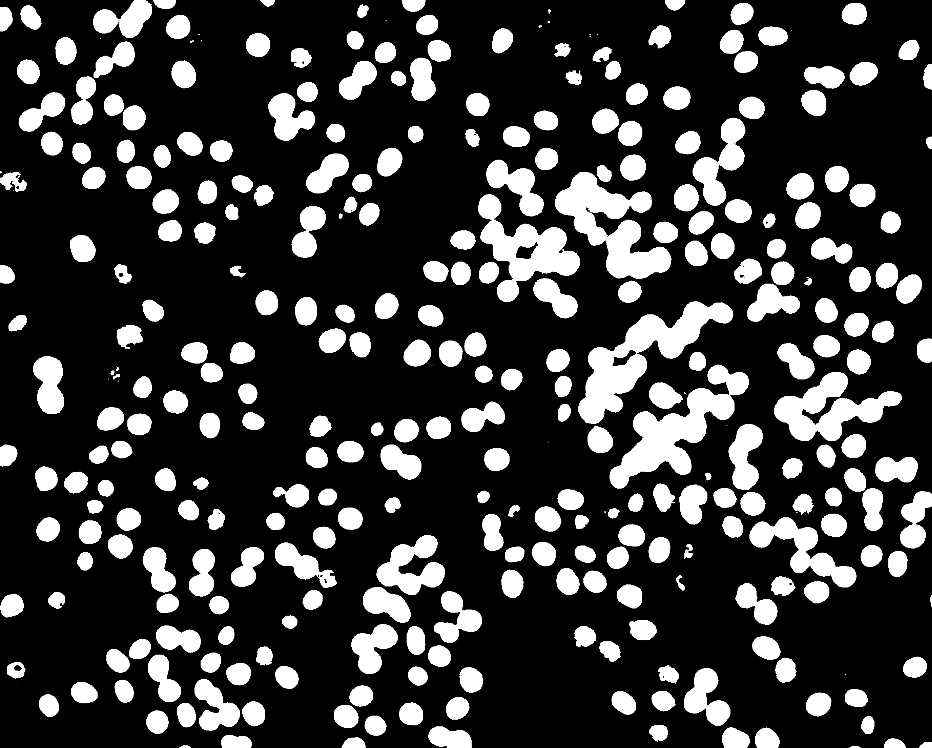
spots = MorphologicalComponents[img2b, .5, Method -> "ConvexHull"];
weededspots = SelectComponents[spots, "Count", # > 20 &];
Image[weededspots]

enter image description here

Length[Union[Flatten[weededspots]]] - 1
 (* 593 *)

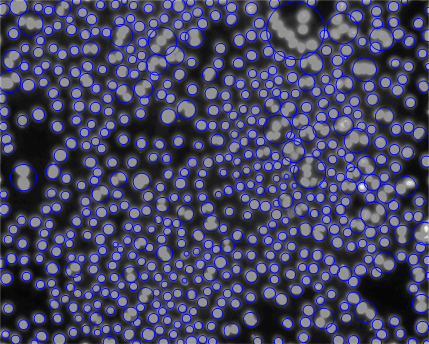
Show[img2b, 
 Graphics[{Blue, Circle[#[[1]], #[[2]]]}] & /@ 
  ComponentMeasurements[weededspots, {"Centroid", "BoundingDiskRadius"}][[All, 2]]]

enter image description here

$\endgroup$
4
$\begingroup$

Here is a way to get a crude approximation, based loosely on this prior MSE thread.

First convert to a black-and-white image.

binimg = Binarize[img]

enter image description here

Get the area of the white space.

areaTotal = ImageMeasurements[binimg, "Total"]

(* Out[309]= 1.390555*10^6 *)

Now estimate the area of a single white dot. We home in on a corner of the image for this.

imgcorner = Image[ImageData[binimg][[1 ;; 250, 1 ;; 250]]]

enter image description here

This shows a reasonable approximation to four dots. We use it to approximate the area of a single dot.

area4 = ImageMeasurements[imgcorner, "Total"];
area1 = area4/4

(* Out[308]= 3435. *)

Now divide total area by single area to approximate the number of these.

areaTotal/area1

(* Out[310]= 404.819505095 *)

There are better methods of course. Might want to check my colleague's blog for example.

$\endgroup$
2
$\begingroup$

When faced with counting a large number of objects on many images after first thinking of graduate students, one should thing of SAMPLING. That science is well-established and known by many but even more who should know better never think of it.

Below is a brief outline of two of many approaches that involve sampling. The first method uses just simple random sampling and the human eye-brain system. The second example combines the human eye-brain system and the ingenious methods described by the other answers to the original question.

Simple random sampling without replacement

Divide the image into a grid of non-overlapping cells. Randomly select $n$ of those without replacement. The estimate of the total number of objects is just the mean count times the total number of cells. A measure of precision (also essential but many times ignored or forgotten) can also be estimated. Here is some Mathematica code to do that:

(* Figure out the boundaries for nGroups in each direction *)
split[nPixels_, nGroups_] := Module[{k, nkPlus1, nk, xUpper, xLower},
  k = Floor[nPixels/nGroups];
  nkPlus1 = nPixels - k nGroups;
  nk = nGroups - nkPlus1;
  x = If[nkPlus1 == 0, ConstantArray[k, nk], Join[ConstantArray[k, nk], ConstantArray[k + 1, nkPlus1]]];
  xUpper = Accumulate[x];
  xLower = Join[{1}, Most[xUpper + 1]];
  {xLower, xUpper}
  ]

(* Given image, split into a nGroups x nGroups grid of cells 
and sample n of those cells without replacement *)
sample[img_, nGroups_, n_] := Module[{},
  (* Get random sample of cells without replacement *)
  col = split[ImageDimensions[img][[1]], nGroups];
  row = split[ImageDimensions[img][[2]], nGroups];
  indices = Flatten[Table[{i, j}, {i, nGroups}, {j, nGroups}], 1];
  samples = RandomSample[indices, n];

  (* Now ask the user to count objects in each cell *)
  counts = ConstantArray[0, n];
  Do[imgSample = 
    ImageTake[img, row[[All, samples[[i, 1]]]], 
     col[[All, samples[[i, 2]]]]];
   counts[[i]] = Input[imgSample], {i, n}];
  (* Return estimate of total number of objects and an associated standard error *)
  {Mean[counts] nGroups^2, 
    Sqrt[1 - n/nGroups^2] StandardDeviation[counts] nGroups^2/Sqrt[n]} // N]

(* Example *)
(* Divide image into a 5x5 grid of sample units and take a sample size of 6 *)
sample[img, 10, 6]
(* {333.3333333333333`,73.69607256232254`} *)

One will be asked to make 6 counts by eye with dialog boxes looking like the following:
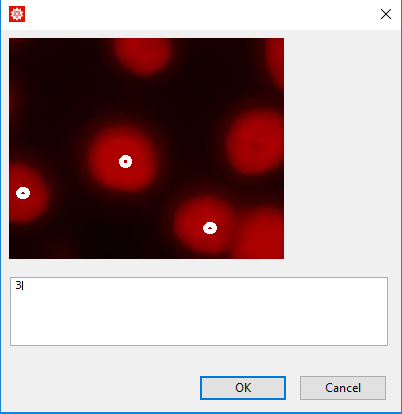
Randomly selected grid cell

Here I've marked the objects counted by eye. (What counting rule was used? Count all objects that are totally self-contained within the cell. Also count the objects that intersect the left and bottom border of the cell but excluding any objects that intersect with the right-hand lower corner of the cell. This is an attempt to reduce boundary issues that affect the count. The sides used and corner excluded could be randomized.)

So the estimate is 333 objects with a standard error of around 74. Not great but one can do much better with the next example.

Ratio estimation

Ratio estimation is a standard statistical technique where one has the ability to make a reasonable (but not necessarily perfect) count for all of the grid cells. Then the "exact" measurement (i.e., human eye/brain system) only needs to be taken on a sample of the grid cells. If the estimate of the number of objects is $X$ from one of the ingenious methods using the Mathematica functions and $\bar{x}$ and $\bar{y}$ are the mean counts of the "reasonable" and "exact" sampled cells, the estimate of the total number of objects in the image is just

$$\bar{X} {\bar{y} \over \bar{x}}$$

An estimate of precision is also easily calculated. If the use of Mathematica functions results in counts proportional to the true count, then the precision will be much, much better than simple random sampling. (I'll add details when I get more time.)

$\endgroup$
3
  • $\begingroup$ One could also, presumably modify this method for training a neural net to recognize certain types of shapes within areas of an image they appear? Or....this is purely statistical extrapolation? $\endgroup$ Commented Aug 19, 2019 at 11:22
  • $\begingroup$ @CATrevillian It would be great if you could add an answer with that approach. $\endgroup$
    – JimB
    Commented Aug 20, 2019 at 4:43
  • $\begingroup$ I agree @JimB! I will add one if I can figure it all out :) my comment was in reference to a question I failed to answer about modifying the neural network functions to determine houses versus other circular house-like structures in an aerial view. This may benefit. I will make an answer after I can complete my prior tasks, or if I must distract myself from them! The encouragement is greatly appreciated :D $\endgroup$ Commented Aug 20, 2019 at 11:06
0
$\begingroup$

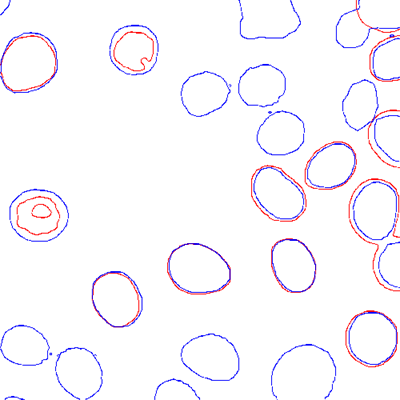
The simple detection of overlapping of the objects can be visualized by following way:

{a1, b1} = {Binarize@ImageAdjust@ColorSeparate[a, "R"], Binarize@ImageAdjust@ColorSeparate[b, "B"]};
{a2, b2} = {
RemoveBackground[ColorReplace[EdgeDetect@a1, White -> Red], {"Background", Black}], 
RemoveBackground[ColorReplace[EdgeDetect@b1, White -> Blue], {"Background", Black}]};

Show[a2, b2, ImageSize -> 400, PlotRange -> {{0, 500}, {0, 500}}]

enter image description here

$\endgroup$

Your Answer

By clicking “Post Your Answer”, you agree to our terms of service and acknowledge you have read our privacy policy.

Not the answer you're looking for? Browse other questions tagged or ask your own question.