2
$\begingroup$

Plotting a matrix with colors depending on the value of each entry is straightforward,

TestMatrix = {{0, 1, 2}, {3, 4, 5}, {6, 7, 8}};
MatrixPlot[TestMatrix, ColorFunction -> "Rainbow"]

But what if the matrix has two-dimensional entries? Something like

TestMatrix = {{{0, 0}, {1, 0}, {2, 0}}, {{3, 1}, {4, 1}, {5, 1}}, {{6,1}, {7, 1}, {8, 1}}};

Defining a two-dimensional color function is simple enough, for instance

Palette = Function[{x, y}, Blend[{Hue[x], GrayLevel[x]}, y]];

But now MatrixPlot won't work! How can it be done?

Bonus points if the method works with ListContourPlot :)

$\endgroup$
1
  • $\begingroup$ What about this: TestMatrix = {{{0, 0}, {1, 0}, {2, 0}}, {{3, 1}, {4, 1}, {5, 1}}, {{6,1}, {7, 1}, {8, 1}}}; MatrixPlot[Flatten[Transpose /@ TestMatrix, 1], ColorFunction -> "Rainbow"]? $\endgroup$
    – Alx
    Commented Jul 30, 2019 at 1:47

2 Answers 2

1
$\begingroup$

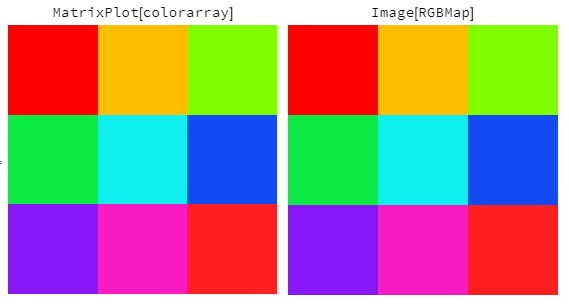
You can use a matrix of colors as input to MatrixPlot:

colorarray = TestMatrix /. {a_?NumericQ, b_} :> Palette[a, b] 

mp = MatrixPlot[colorarray, Frame -> False, ImageSize -> 300, PlotRangePadding -> 0];

img = Image[RGBMap, ImageSize -> 300];

Row[{Labeled[mp, Style["MatrixPlot[colorarray]", 16], Top], 
     Labeled[img, Style["Image[RGBMap]", 16], Top]}, 
    Spacer[5]]

enter image description here

Alternatively, you can construct colorarray Applying Palette to each entry:

colorarray = Apply[Palette, TestMatrix, {-2}];

Note: You can get RGBMap using colorarray /. RGBColor -> List:

RGBMap == colorarray /. RGBColor -> List

True

$\endgroup$
1
$\begingroup$

Okay, I figured out how to do it.

First, we normalize the matrix to be between 0 and 1 for convenience, and define the two-dimensional color palette

TestMatrix = {{{0, 0}, {1, 0}, {2, 0}}, {{3, 1}, {4, 1}, {5, 1}}, {{6,1}, {7, 1}, {8, 1}}};
TestMatrix = TestMatrix/Max[TestMatrix];
Palette = Function[{x, y}, Blend[{Hue[x], GrayLevel[x]}, y]];

Then, we define a function that extracts the RGB values from any color that Palette outputs,

RGBExtractor = Function[x, {x[[1]], x[[2]], x[[3]]}];

Finally, we convert from matrix entries to RGB values and output the result as an image

RGBMap = Table[RGBExtractor[Palette[TestMatrix[[i, j, 1]], TestMatrix[[i, j, 2]]]],
 {i, 1, Length[TestMatrix[[1]]]}, {j, 1, Length[TestMatrix[[1]]]}];
Image[RGBMap, ImageSize -> 300]
$\endgroup$

Your Answer

By clicking “Post Your Answer”, you agree to our terms of service and acknowledge you have read our privacy policy.

Not the answer you're looking for? Browse other questions tagged or ask your own question.