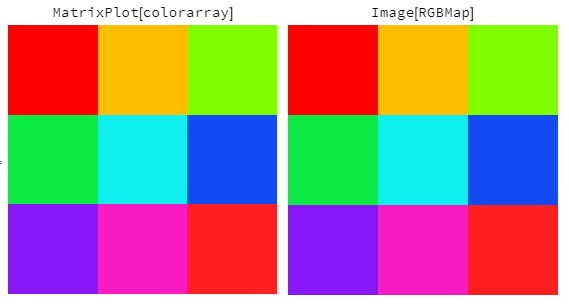
Plotting a matrix with colors depending on the value of each entry is straightforward,
TestMatrix = {{0, 1, 2}, {3, 4, 5}, {6, 7, 8}};
MatrixPlot[TestMatrix, ColorFunction -> "Rainbow"]
But what if the matrix has two-dimensional entries? Something like
TestMatrix = {{{0, 0}, {1, 0}, {2, 0}}, {{3, 1}, {4, 1}, {5, 1}}, {{6,1}, {7, 1}, {8, 1}}};
Defining a two-dimensional color function is simple enough, for instance
Palette = Function[{x, y}, Blend[{Hue[x], GrayLevel[x]}, y]];
But now MatrixPlot won't work! How can it be done?
Bonus points if the method works with ListContourPlot :)


TestMatrix = {{{0, 0}, {1, 0}, {2, 0}}, {{3, 1}, {4, 1}, {5, 1}}, {{6,1}, {7, 1}, {8, 1}}}; MatrixPlot[Flatten[Transpose /@ TestMatrix, 1], ColorFunction -> "Rainbow"]? $\endgroup$