5
$\begingroup$

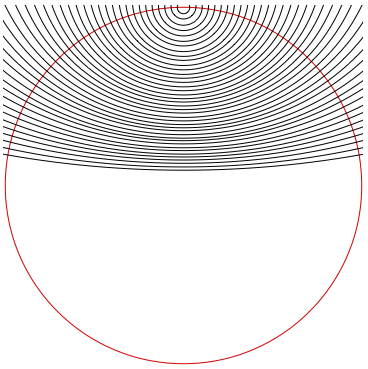
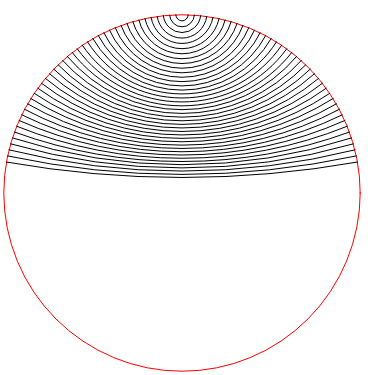
I would like to only show the part of Black circles within the Red circle.

Can I do that with Graphics, Circle and/or some sort of Region Constraint?

the upper half

step = 2 Degree;
\[Alpha] = Range[2 Degree, 80 Degree, step];
x = ConstantArray[0, Length@\[Alpha]];
y = Sec@\[Alpha];
radius = Tan@\[Alpha];
range = 1.01;
Graphics[{Red, Circle[{0, 0}, 1], Black, 
  MapThread[Circle[{#1, #2}, #3] &, {x, y, radius}]}, 
 PlotRange -> {{-range, range}, {-range, range}}]

At the moment, I use ContourPlot with RegionFunction option. However, my plot contains a large number of these circles (The amount of the circles shown here is only a quarter for the current step), which makes ContourPlot approach very slow. Moreover, when I zoom in, quite often I find the circles drawn by ContourPlot are not circular, presumably due to PlotPoints and MaxRecursion etc. I tried to play with these two options, but did not succeed in terms of quality (being a circle) and speed.

Thank you!

$\endgroup$
0

2 Answers 2

6
$\begingroup$

You can use the three-argument form of Circle:

Graphics[{Red, Circle[{0, 0}, 1], Black, 
    MapThread[Circle[{#1, #2}, #3, {π + ArcTan[#3], 2 π - ArcTan[#3]}] &, 
     {x, y, radius}]}, 
  PlotRange -> {{-range, range}, {-range, range}}]

enter image description here

Alternatively, use RegionIntersection with Disk[] to get the needed portions of black circles:

circles = MapThread[Circle[{#1, #2}, #3] &, {x, y, radius}];

circles2 = RegionIntersection[Disk[], #] & /@ N[circles];

Graphics[{Red, Circle[{0, 0}, 1], Black,  circles2}, 
  PlotRange -> {{-range, range}, {-range, range}}]

same picture

Update: An alternative way to hide unwanted portions of circles using FilledCurve:

filledCurve = FilledCurve[{{Line[Append[#, First @ #]& @ 
   CirclePoints[range Sqrt @2, 4]]}, 
  {Line[Append[#, First @ #]& @ CirclePoints[200]]}}];

Graphics[{Red, Circle[{0, 0}, 1], Black,  circles, 
  EdgeForm[None], White, filledCurve}, 
 PlotRange -> {{-range, range}, {-range, range}}]

same picture as above

$\endgroup$
2
  • $\begingroup$ I used the 1st method of yours, which is the fastest among all the provided answers at the moment. But it seems the ArcTan[#3 Sqrt[1/(1 + #3^2)] Sqrt[1 + #3^2]] can be shortened to ArcTan[#3]. Also, the center of the circles lies along the y axis, which is a special case. I wonder what this method could be if the center of the circle is arbitrary. Could you please elaborate if possible? Thanks. I realized that for the "arbitrary center" case, it requires the actual information of the circle, and therefore, it maybe changes from case to case. $\endgroup$
    – user34223
    Commented Jul 14, 2019 at 6:33
  • $\begingroup$ @Bemtevi77, updated with the simpler form. Re arbitrary centers, I think the second and third methods should work as is. I think the first method should also work but I am not sure. $\endgroup$
    – kglr
    Commented Jul 14, 2019 at 6:42
5
$\begingroup$
g = Graphics[{Red, Circle[{0, 0}, 1], Black, 
   MapThread[Circle[{#1, #2}, #3] &, {x, y, radius}]}, 
  PlotRange -> {{-range, range}, {-range, range}}];

Show[g, RegionPlot[x^2 + y^2 > 1, {x, -1.2, 1.2}, {y, -1.2, 1.2}, 
  PlotStyle -> White]]

enter image description here

$\endgroup$
1
  • $\begingroup$ I realized that this method can be easily applied to "circles with arbitrary center and radius" as asked in my comment to kglr's answer. It may not be the fastest, but is more versatile, in my opinion. Thank you very much! $\endgroup$
    – user34223
    Commented Jul 14, 2019 at 6:43

Your Answer

By clicking “Post Your Answer”, you agree to our terms of service and acknowledge you have read our privacy policy.