4
$\begingroup$

Is there any specific function for this type of presentation formed by the code $dim1$, $dim2$ and $dim3$?

Barra

p1 = {0, 0} (*Ponto1 de apoio da barra*);p2={1,0}(*Ponto2 de apoio da barra*);
barra = Graphics[{Thickness[0.02], Line[{p1, p2}]}];

Suporte1

hsup =.08 (*Altura do suporte*);
sup1 = 
  Graphics[
    {GrayLevel[0.34], Thickness[0.005] (*Espessura do Suporte*), 
     Line[
       {{p1[[1]] - hsup/2, -hsup}, {p1[[1]] + hsup/2, -hsup}, 
        p1,{p1[[1]] - hsup/2, -hsup}}]}];

Suporte2

sup2 = 
  Graphics[
    {GrayLevel[0.34], Thickness[0.005] (*Espessura do Suporte*),  
     Line[
       {{p2[[1]]  - hsup/2, -hsup}, {p2[[1]] + hsup/2, -hsup},
        p2, {p2[[1]] - hsup/2, -hsup}}]}];

Força

posx = 0.2*(p2[[1]] - p1[[1]]) (*Comprimento da barra*);
f1 = 
  Graphics[
    {Red, Thickness[0.02] (*Espessura da seta*), 
     Arrowheads[hf1/3], Arrow[{{posx, hf1 = 0.25},{posx,p1[[2]]}}]}];

Dimensão L

dim1 = 
  Graphics[
    {Thickness[0.003], 
     Line[{Offset[{0, off1 = 20}, p1], Offset[{0, off2 = 400}, p1]}]}];
dim2 = 
  Graphics[
    {Thickness[0.003], 
     Line[{Offset[{0, off1}, p2], Offset[{0, off2}, p2]}]}];
dim3 = 
  Graphics[
    {Thickness[0.003], Arrowheads[{-.1, .1}], 
     Arrow[{Offset[{0, off2 - 50}, p1], Offset[{0, off2 - 50}, p2]}]}];

Diagrama

Show[{sup1, sup2, barra, f1, dim1, dim2, dim3},
  Axes - >{True, False},
  ImageSize -> Full,
  AxesStyle -> Directive[Blue, AbsoluteThickness[3], FontSize -> 20]]

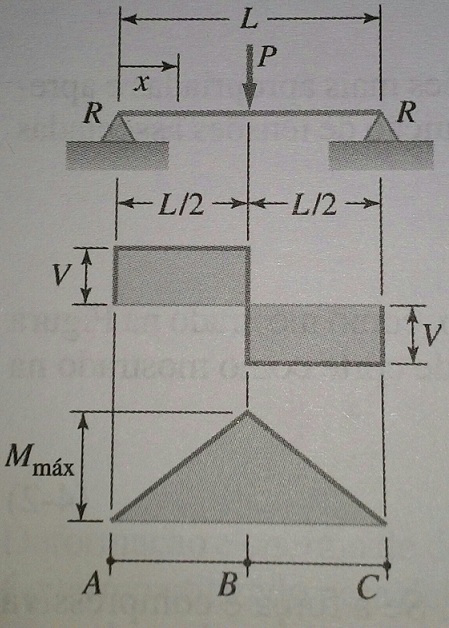
I am wanting to create something like this:

enter image description here

$\endgroup$
13
  • 4
    $\begingroup$ i don't think that Mathematica is the right tool for the job here. Consider using a vector graphics program instead. I use the free InkScape. $\endgroup$
    – MarcoB
    Commented Jul 5, 2016 at 4:17
  • 2
    $\begingroup$ I regularly make my illustrations to scientific papers with Mma more or less like you did it above. Technically my illustrations are comparable in complexity with your image, or (sometimes) more complex. So, I do not see here any problem. On the other hand, there is no special function(s) for that. One idea to simplify/accselerate the drawing would be to wrap the whole image by the Manipulate statement and search dynamically for, say, coordinates of the elements of your drawing. You might do it still faster by using a locator. $\endgroup$ Commented Jul 5, 2016 at 8:09
  • 3
    $\begingroup$ @MarcoB I beg to differ. It is/would be very useful to have that capability in Mathematica. Automating dimensioning can save a lot of time for repetitive tasks. $\endgroup$
    – Yves Klett
    Commented Jul 5, 2016 at 8:11
  • 2
    $\begingroup$ @Kuba the problem is that if one wants to make changes. So it is best to have this done using code, so it is automated. This is not an easy thing to do. Tikz, which is specialized for graphics, does not do dimensions. Doing automatic dimensions is a very very hard problem. Half of the code in CAD application is related to dimension software for engineering drawing. For example, if you want to change length of a line,whath should happen to the dimensions attached to it? etc... This is all automated in CAD engineering software. This is not trivial at all to do. $\endgroup$
    – Nasser
    Commented Jul 5, 2016 at 11:09
  • 1
    $\begingroup$ There are the GraphicsTools and MechanicsTools Packages (link: cit.blinn.edu/physics/Mathematica/index.html ) that provide some shared Graphics tools for physics diagrams, See also the library link: library.wolfram.com/infocenter/Conferences/9044 $\endgroup$ Commented Jul 5, 2016 at 13:59

1 Answer 1

4
$\begingroup$

To give you an example of using the locator within your image try this:

      p1 = {0, 0}(*Ponto1 de apoio da barra*); p2 = {1, 
  0}(*Ponto2 de apoio da barra*);
barra = Graphics[{Thickness[0.02], Line[{p1, p2}]}];
hsup = .08(*Altura do suporte*); sup1 = 
 Graphics[{GrayLevel[0.34], Thickness[0.005](*Espessura do Suporte*), 
   Line[{{p1[[1]] - hsup/2, -hsup}, {p1[[1]] + hsup/2, -hsup}, 
     p1, {p1[[1]] - hsup/2, -hsup}}]}];
sup2 = Graphics[{GrayLevel[0.34], 
    Thickness[0.005](*Espessura do Suporte*), 
    Line[{{p2[[1]] - hsup/2, -hsup}, {p2[[1]] + hsup/2, -hsup}, 
      p2, {p2[[1]] - hsup/2, -hsup}}]}];
posx = 0.2(*Porcentagem relativa ao comprimento da barra*)*(p2[[1]] - 
     p1[[1]])(*Comprimento da barra*);
f1 = Graphics[{Red, Thickness[0.02](*Espessura da seta*), 
    Arrowheads[hf1/3], 
    Arrow[{{posx, hf1 = 0.25(*Altura da seta*)}, {posx, p1[[2]]}}]}];
dim1 = Graphics[{Thickness[0.003], 
    Line[{Offset[{0, off1 = 20}, p1], Offset[{0, off2 = 400}, p1]}]}];
dim2 = Graphics[{Thickness[0.003], 
    Line[{Offset[{0, off1}, p2], Offset[{0, off2}, p2]}]}];
dim3 = Graphics[{Thickness[0.003], Arrowheads[{-.1, .1}], 
    Arrow[{Offset[{0, off2 - 50}, p1], Offset[{0, off2 - 50}, p2]}]}];

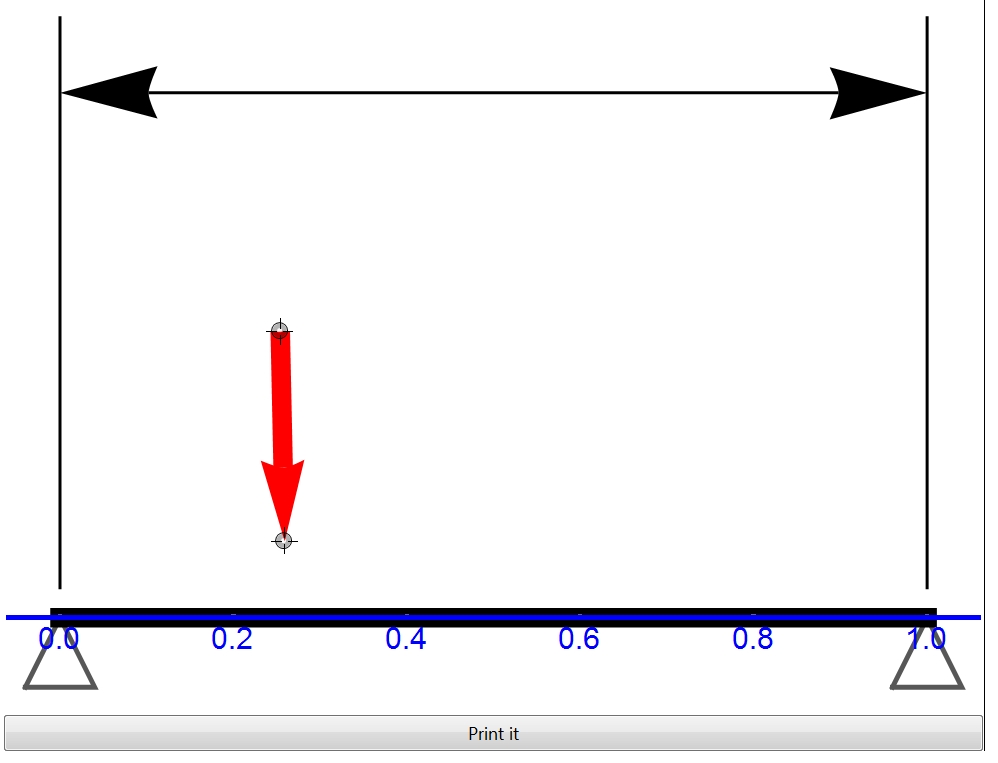
Here are your definitions, and I am playing with the positioning of a red arrow using the locators below:

DynamicModule[{pt1 = {0.5, 0.5}, pt2 = {0.5, 0.7}},
 f1 = Graphics[{Red, Thickness[0.02](*Espessura da seta*), 
    Arrowheads[hf1/3], Dynamic[Arrow[{pt1, pt2}]]}];
 Column[{
   Show[{sup1, sup2, barra, f1, dim1, dim2, dim3,
     Graphics[{Locator[Dynamic[pt1]], Locator[Dynamic[pt2]]}]     
     }, Axes -> {True, False}, ImageSize -> Full, 
    AxesStyle -> 
     Directive[Blue, AbsoluteThickness[3], FontSize -> 20]],
   Button["Print it", Column[{Print[pt1], Print[pt2]}]]
   }]
 ]

enter image description here

After you have positioned the arrow, press the button and the coordinates will appear below the image. Copy-paste them instead of pt1 and pt2 into the code. Revove the Dynamic statement around the Arrow statement. When the positioning of all elements is terminated, remove unnecessary elements from the code.

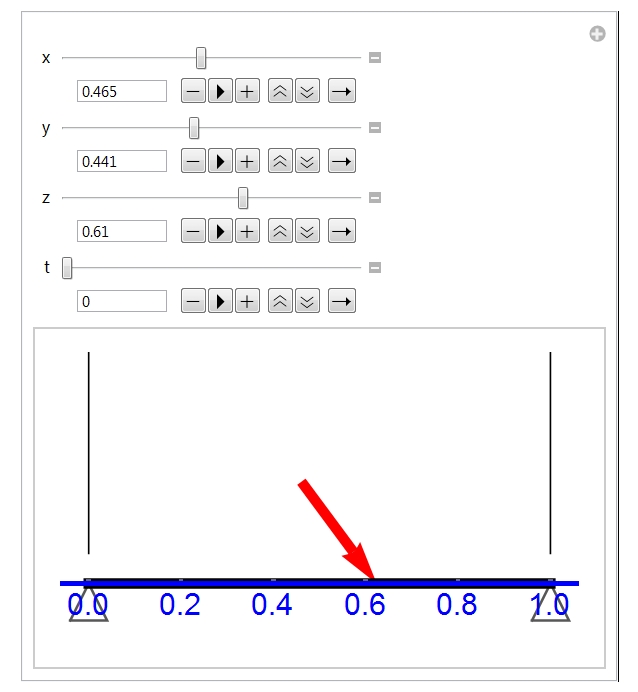
Here is the realization with the Manipulate statement:

     Manipulate[

     f1 = Graphics[{Red, Thickness[0.02](*Espessura da seta*), 
        Arrowheads[hf1/3], Arrow[{Scaled[{x, y}], Scaled[{z, t}]}]}, 
       PlotRange -> {0, 0.5}];

     Column[{
       Show[{f1, sup1, sup2, barra, dim1, dim2, dim3

         }, Axes -> {True, False}, ImageSize -> 350, 
        AxesStyle -> 
         Directive[Blue, AbsoluteThickness[3], FontSize -> 20]],

       }], {x, 0, 1}, {y, 0, 1}, {z, 0, 1}, {t, 0, 1}

 ]

enter image description here

Position the arrow with the sliders. After it is done, copy-paste the figures from the text fields of the Manipulate panel into the Arrow statement. Start positioning other elements of the figure. After the image is finished, remove all elements of the manipulate statement.

Have fun!

$\endgroup$

Your Answer

By clicking “Post Your Answer”, you agree to our terms of service and acknowledge you have read our privacy policy.

Not the answer you're looking for? Browse other questions tagged or ask your own question.