6
$\begingroup$

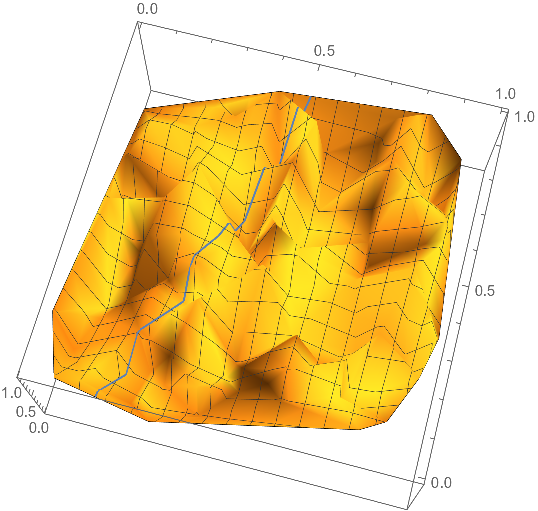
Starting from i.e. the following 3d plot:

d = RandomReal[1, {100, 3}];
ListPlot3D[d]

Is it possible to extract points that lay along an arbitrarily oriented line, i.e. like this:

Show[{ListPlot3D[d], Graphics3D[Line[{{0, -.5, 1}, {0.5, 1, 1}}]]}]

?

EDIT: Z values of the plot along the line projected onto the x-y plane

$\endgroup$
2
  • $\begingroup$ Can you clarify a little, are you looking for the points that exactly intersect that line, or the z values of the plot along the line projected onto the x-y plane? $\endgroup$
    – N.J.Evans
    Commented Jul 9, 2019 at 18:19
  • 1
    $\begingroup$ z values of the plot along the line projected onto the x-y plane $\endgroup$
    – ATomek
    Commented Jul 9, 2019 at 18:24

2 Answers 2

9
$\begingroup$
SeedRandom[5]
d = RandomReal[1, {100, 3}];

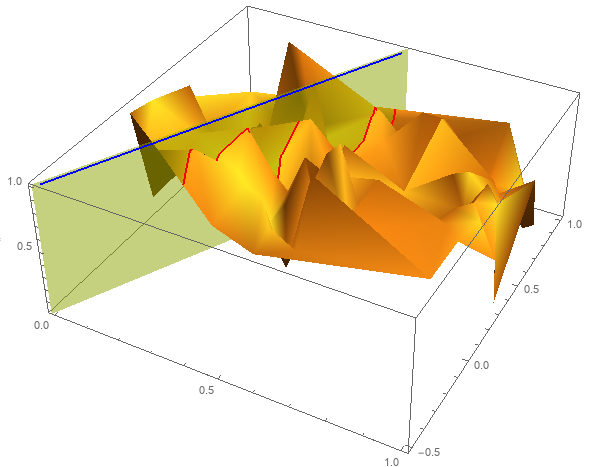
You can use -.5 + 3 # - #2 & (or Function[{x, y}, -.5 + 3 x - y]) as the setting for MeshFunctions in ListPlot3D:

Show[lp3d = ListPlot3D[d, MeshFunctions -> {-.5 + 3 # - #2 &}, 
    Mesh -> {{0}}, MeshStyle -> Directive[Red, Thick], BoundaryStyle -> None], 
  Graphics3D[{Thick , Blue, Line[{{0, -.5, 1}, {0.5, 1, 1}}], 
    Opacity[.5, Yellow], EdgeForm @ None, 
    InfinitePlane[{{0, -.5, 0}, {0, -.5, 1}, {0.5, 1, 1}}]}]]
enter image description here

To extract the points on the red line:

Cases[Normal @ lp3d, Line[x_] :> x, All][[1]]

{{0.492655, 0.977959, 0.559503}, {0.491386, 0.973947,    0.484116}, {0.477966, 0.933211, 0.303948}, {0.476062, 0.92816,    0.451244}, {0.459746, 0.878862, 0.640324}, {0.457492, 0.872273,    0.586974}, {0.454029, 0.861943, 0.568448}, {0.441994, 0.825895,    0.39336}, {0.396855, 0.690417, 0.20754}, {0.395551, 0.686462,    0.255852}, {0.392548, 0.677572, 0.17963}, {0.350269, 0.550753,    0.612022}, {0.341512, 0.524435, 0.760695}, {0.313441, 0.440292,    0.52727}, {0.304016, 0.411343, 0.164743}, {0.300216, 0.400556,    0.123016}, {0.293312, 0.379549, 0.431375}, {0.279583, 0.33874,    0.571648}, {0.267421, 0.302245, 0.850239}, {0.266698, 0.299818,    0.85685}, {0.226072, 0.177329, 0.737677}, {0.217928, 0.152775,    0.650557}, {0.192837, 0.0784445, 0.831587}, {0.187349, 0.0619587,    0.854096}, {0.174868, 0.024533, 0.602241}}

$\endgroup$
5
$\begingroup$

You can use the interpolation that ListPlot uses, which you can then evaluate at any point on the line (within the domain of the interpolation):

zFN = Interpolation[d, InterpolationOrder -> 1, 
   "ExtrapolationHandler" -> {Indeterminate &, "WarningMessage" -> False}];

ClearAll[xyline, zSect];
xyline[x_] = {(1 - 2 x), 2 x}.{{0, -.5}, {0.5, 1}};
zSect[x_] := zFN @@ xyline[x];

zSect[0.25]  (* test a value *)
(*  0.654833  *)

Show[
 ListPlot3D[d],
 ParametricPlot3D[Append[xyline[x], zSect[x]], {x, 0, 1}]
 ]

enter image description here

$\endgroup$

Your Answer

By clicking “Post Your Answer”, you agree to our terms of service and acknowledge you have read our privacy policy.

Not the answer you're looking for? Browse other questions tagged or ask your own question.