1
$\begingroup$

I came across this bizarre behaviour whilst noodling around - a change in 'Plot' results...

testPlot1 = Plot[Log[HarmonicNumber[n]], 
   {n, 1, 5}]; 
testPlot2 = Plot[Log[HarmonicNumber[n]], 
   {n, 1, 43}]; 
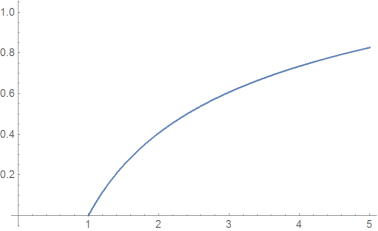
Show[testPlot1, PlotRange -> {{0, 5}, {0, 1}}]
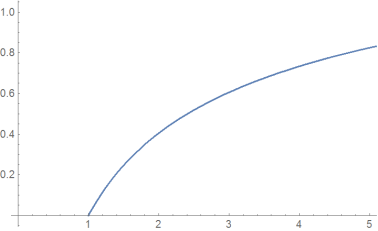
Show[testPlot2, PlotRange -> {{0, 5}, {0, 1}}]

The line moves away from the origin, crossing the n line increasingly far to the right, and giving no negative output - it just vanishes at the n line.

At first I thought it happened exclusively for n>=43, but actually, it seems to happen randomly for different domain ranges. Using Table gives the correct result.

What's going wrong, and how do I fix it?

$\endgroup$
1
  • 1
    $\begingroup$ In the first case, you are not setting PlotRange at all, but in Show you are using specific PlotRange. So why do you expect the results to look the same? $\endgroup$
    – Nasser
    Commented Jun 17, 2019 at 12:54

2 Answers 2

3
$\begingroup$

Use the plotoption AxesOrigin->{0,0}:

testPlot1 =Plot[Log[HarmonicNumber[n]], {n, 1, 5}, AxesOrigin -> {0, 0}] ;
testPlot2 =Plot[Log[HarmonicNumber[n]], {n, 1, 43}, AxesOrigin -> {0, 0}] ;

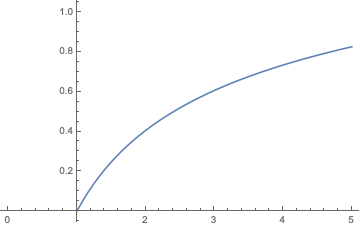
Show[testPlot1, PlotRange -> {{0, 5}, {0, 1}}]

enter image description here

Show[testPlot2, PlotRange -> {{0, 5}, {0, 1}}]

enter image description here

same plot in both cases!

$\endgroup$
5
  • $\begingroup$ Hi @Ulirch. Do you mean AxesOrigin? (With an 'e') $\endgroup$ Commented Jun 17, 2019 at 12:49
  • $\begingroup$ Sorry: Yes I meant AxesOrigin $\endgroup$ Commented Jun 17, 2019 at 12:54
  • $\begingroup$ I'm afraid that doesn't seem to work.If I specify AxesOrigin -> {0, 0} for testPlot2, the curve still hits the n line at n=1 - which is mathematcally incorrect. If I use it for testPlot1 and testPlot2 the curve still intersects the n line in different places for each plot. Mathematica is changing the actual values of the plot, not where the axes are. $\endgroup$ Commented Jun 17, 2019 at 12:55
  • $\begingroup$ I would expect Log[HarmonicNumber[1]]==0 $\endgroup$ Commented Jun 17, 2019 at 13:02
  • $\begingroup$ You're right @Ulrich (and that was what I expected too). I must have entered something wrongly. Much appreciated. $\endgroup$ Commented Jun 17, 2019 at 13:03
1
$\begingroup$

Another solution: increase the PlotPoints in testPlot2:

testPlot1 = Plot[Log[HarmonicNumber[n]], {n, 1, 5}];
testPlot2 = 
  Plot[Log[HarmonicNumber[n]], {n, 1, 43}, PlotPoints -> 100];
Show[testPlot1, PlotRange -> {{0, 5}, {0, 1}}]
Show[testPlot2, PlotRange -> {{0, 5}, {0, 1}}]

Mathematica graphics Mathematica graphics

$\endgroup$
3
  • $\begingroup$ Hi @Chris. Also good. I have ticked Ulrich's because he got there first, but I appreciate the suggestion. $\endgroup$ Commented Jun 17, 2019 at 13:15
  • $\begingroup$ No prob -- nothing stops you from upvoting multiple answers BTW :) $\endgroup$
    – Chris K
    Commented Jun 17, 2019 at 13:24
  • $\begingroup$ The magic number of PlotPoints must be >5, but the option PlotPoints -> {Automatic, {1}}] works to#o! $\endgroup$ Commented Jun 17, 2019 at 13:37

Your Answer

By clicking “Post Your Answer”, you agree to our terms of service and acknowledge you have read our privacy policy.

Not the answer you're looking for? Browse other questions tagged or ask your own question.