0
$\begingroup$

i am doing very simple thing when I run this line:

ListLogPlot[Table[1/x, {x, 10^Range[-2, 1, .1]}],PlotMarkers -> Automatic, Joined -> True]

I get following plot. There is a gap between line segments and markers. enter image description here
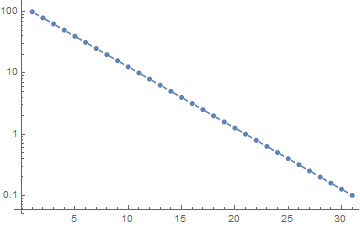
Any idea where does it come from?

$\endgroup$
3
  • 1
    $\begingroup$ Can't reproduce it in 11.3 and 12.0 on Windows 10 32-bit.. Which version of MMA do you use? $\endgroup$
    – user64494
    Commented Jun 11, 2019 at 16:19
  • $\begingroup$ I tried both 11.3 and 12 $\endgroup$
    – Mohammad
    Commented Jun 11, 2019 at 16:21
  • $\begingroup$ See dropbox.com/s/qcbn9r0glldsgql/plot.pdf?dl=0 $\endgroup$
    – user64494
    Commented Jun 11, 2019 at 16:42

0

Your Answer

By clicking “Post Your Answer”, you agree to our terms of service and acknowledge you have read our privacy policy.

Browse other questions tagged or ask your own question.