0
$\begingroup$

I'm looking to specify the appearance of contour plots globally in my Mathematica notebook. This is easily done with SetOptions:

SetOptions[ContourPlot, 
BaseStyle -> {FontFamily -> "Latin Modern Math",
FontSize -> 14}];

However, this does not apply to BarLegend:

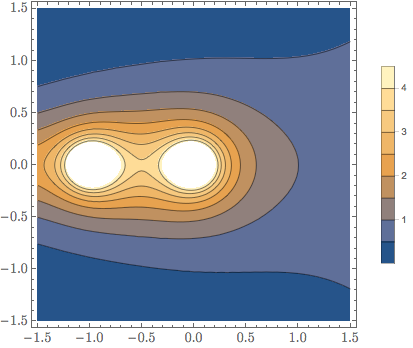
 ContourPlot[Abs[Gamma[u + I v]], {u, -1.5, 1.5}, 
{v, -1.5, 1.5}, PlotLegends -> Automatic]

Contour plot of Gamma function.

I have tried to set global options for BarLegend:

SetOptions[BarLegend, LabelStyle -> {FontFamily 
-> "Latin Modern Math", FontSize -> 14}];

but this seems to have no effect! How can I achieve this?

PS: Using v.10.3.0

$\endgroup$

1 Answer 1

1
$\begingroup$

Figured it out, the options had to be specified for the ContourPlot itself:

SetOptions[ ContourPlot, 
BaseStyle -> {FontFamily -> "Latin Modern Math", 
FontSize -> 14}, LabelStyle -> {FontFamily 
-> "Latin Modern Math", FontSize -> 14}];

Important: Specifying LabelStyle in your plots will automatically over rule this so the BarLegend will have a different style to the ContourPlot. This was actually the source of much confusion.

Hope this is at least helpful to someone.

$\endgroup$

Your Answer

By clicking “Post Your Answer”, you agree to our terms of service and acknowledge you have read our privacy policy.

Not the answer you're looking for? Browse other questions tagged or ask your own question.