4
$\begingroup$

I'm trying to make a density plot of some data on a solid sphere, but I couldn't get ListDensityPlot3D to plot anything. I think there's something I'm missing, as I can't even get a simple plot to work with this function.

data = Flatten[Table[{r Sin[θ] Cos[ϕ], r Sin[θ] Sin[ϕ], r Cos[θ], Cos[θ]},
                     {r, 0, 1, 0.1}, {θ, 0, π, π/10}, {ϕ, 0, 2 π, 2 π/20}], 2];
cleandata = DeleteDuplicates[data];
Dimensions[cleandata]
ListPointPlot3D[cleandata[[;; , {1, 2, 3}]], BoxRatios -> {1, 1, 1}]
ListDensityPlot3D[cleandata]

The first command creates a list of {x,y,z,f} points. The second removes the duplicate points along the z axis. The third just shows the dimensions, demonstrating that they're correct. The fourth shows the locations of the points in 3D space. I expect the fifth to give me the density plot, but instead it shows nothing. This is the subject of my confusion.

What am I missing?

Edit: Fixed code to remove duplicates on z axis.

$\endgroup$
4
  • $\begingroup$ One problem might be that the first 231 points that you generate are all {0, 0, 0, f}. Your list has a ton of duplicated points, and I don't think Mathematica will plot properly with a bunch of duplicates. $\endgroup$
    – MassDefect
    Commented May 30, 2019 at 15:42
  • $\begingroup$ Duplicates now removed (see updated code). Still have the same issue. $\endgroup$
    – Jolyon
    Commented May 30, 2019 at 15:52
  • $\begingroup$ you do get an output with smaller input data: e.g. ListDensityPlot3D[RandomSample[data,250]] works. $\endgroup$
    – kglr
    Commented May 30, 2019 at 16:12
  • $\begingroup$ Huh. Sometimes I do, sometimes I don't. Depends on the sample, I guess? $\endgroup$
    – Jolyon
    Commented May 30, 2019 at 16:16

1 Answer 1

2
$\begingroup$

Looking into this some more, I think the problem might be that it's having difficulty doing interpolation between irregularly spaced (in Cartesian coordinates) points. I know higher order interpolations always yell at me if the points aren't nicely spaced. If this is the case, it's surprising that it doesn't throw an error message and simply fails. I'm not positive this is what's going on, but it seems like I get a reasonable result if I space the coordinates regularly in $x$, $y$, and $z$.

cubedata = 
  Flatten[
    Table[
      {x, y, z, 
        If[
          Sqrt[x^2 + y^2 + z^2] <= 1, 
          Cos[ToSphericalCoordinates[{x, y, z}][[2]]],
          0
        ]}, 
      {x, -1.19, 1.19, 0.08}, {y, -1.19, 1.19, 0.08}, {z, -1.19, 1.19, 0.08}
     ], 
   2];
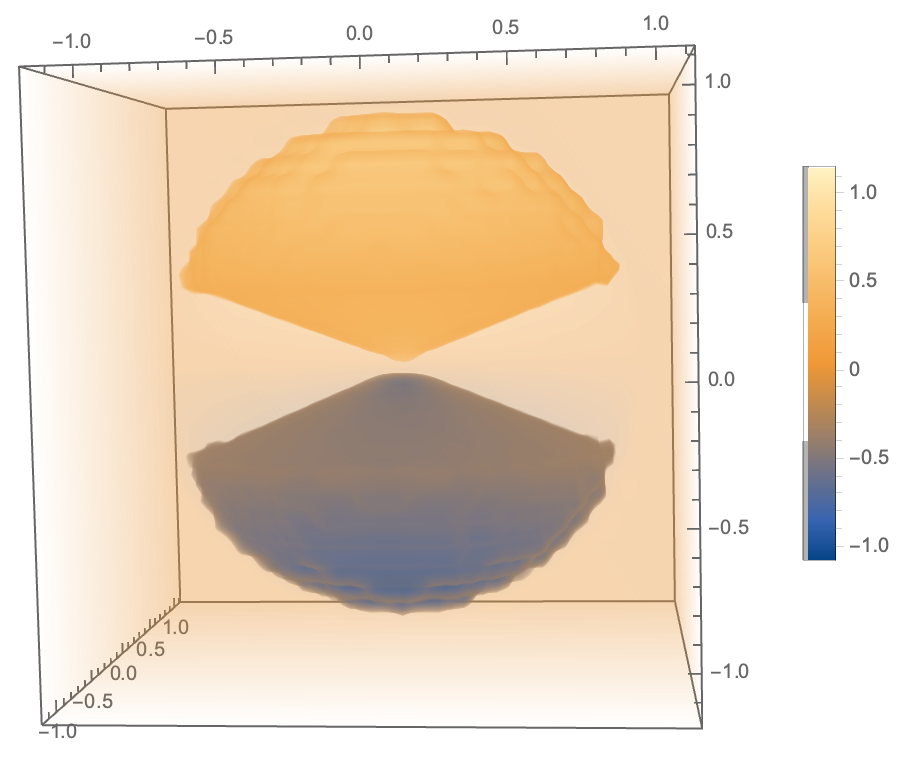
ListDensityPlot3D[cubedata, PlotLegends -> Automatic]
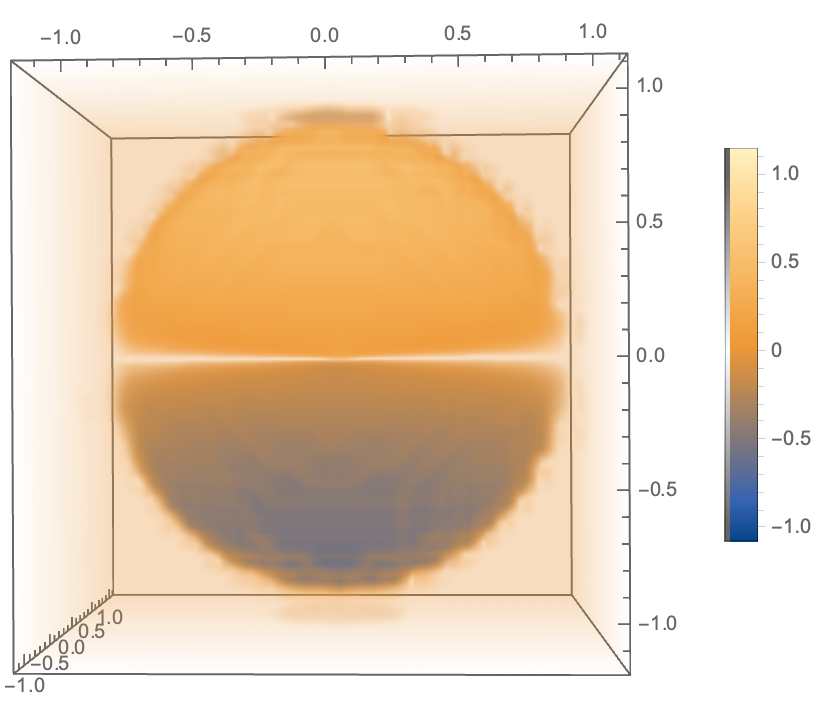
ListDensityPlot3D[cubedata, PlotLegends -> Automatic, 
  OpacityFunction -> (Abs[#] &), OpacityFunctionScaling -> False]

ListDensityPlot3D of cubedata with zero opacity from -0.4 to 0.4.

ListDensityPlot3D of cubedata with zero opacity only at 0.

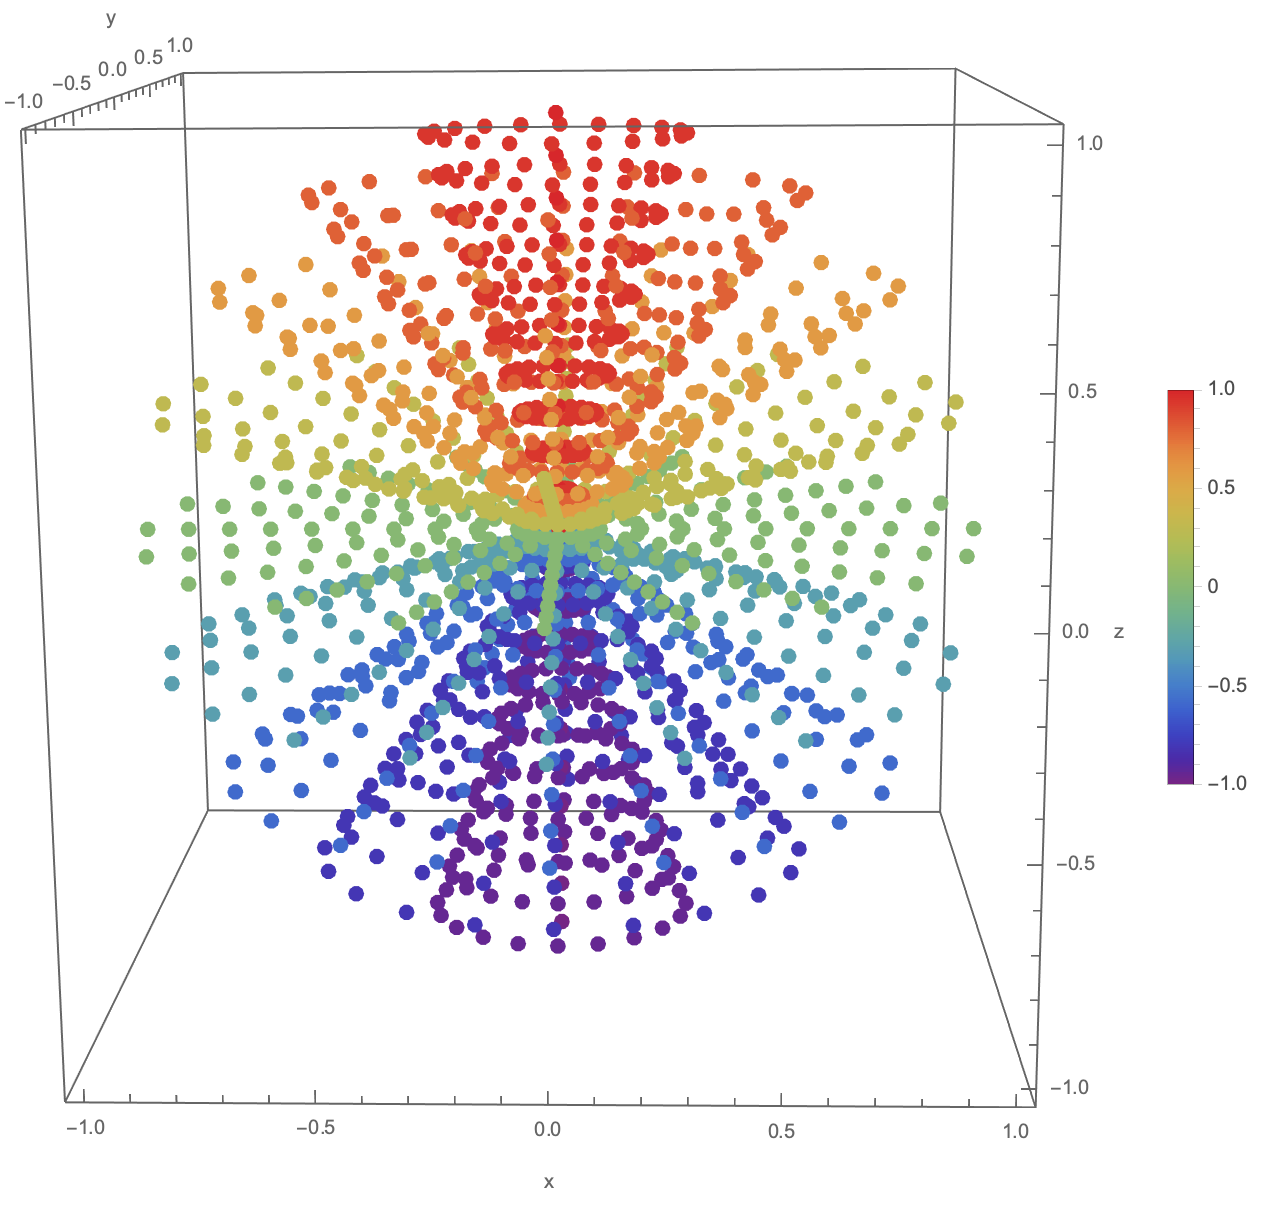
And just out of curiousity, following this post What are the possible ways of visualizing a 4D function in Mathematica?, we can visualize the points with colours (where data is the same as the data you define above).

cleandata = DeleteDuplicatesBy[data, #[[1 ;; 3]] &];
Legended[
  Graphics3D[{
    AbsolutePointSize[8],
    Point[
      cleandata[[All, 1 ;; 3]], 
      VertexColors -> (ColorData["Rainbow"] /@ Rescale[cleandata[[All, 4]]])]
    },
    Axes -> True,
    AxesLabel -> {"x", "y", "z"}
  ],
  BarLegend[{"Rainbow", {-1, 1}}]
]

Point plot of data.

$\endgroup$
2
  • 1
    $\begingroup$ Yeah, this is basically where I'm at (this whole post, lol). Unfortunately, Cartesian data is significantly more expensive to compute than spherical data (I have spherical harmonic mode functions). I'm surprised that it's failing to interpolate without any error message, which is unusual. I've seen the bottom technique (any reason there isn't an easier way to assign colors to points on a 3D plot, MMA???), but it's not optimal for my data set, which is very blobby (and much higher resolution). I might try to make 3D contour plots instead... $\endgroup$
    – Jolyon
    Commented May 31, 2019 at 2:45
  • $\begingroup$ @Jolyon Ah, well hopefully someone with more knowledge than I will be able to help you out! It does seem weird to me that it doesn't like your data. I'm pretty sure I've seen irregularly spaced data plotted before using ListDensityPlot3D so maybe it's something else that is causing the problem. $\endgroup$
    – MassDefect
    Commented May 31, 2019 at 3:12

Your Answer

By clicking “Post Your Answer”, you agree to our terms of service and acknowledge you have read our privacy policy.

Not the answer you're looking for? Browse other questions tagged or ask your own question.