0
$\begingroup$

I have the following ListStepPlot:

ListStepPlot[{1, 1, 1, 1, 1, 1, 1, 1, 1, 1, 1, 1, 1, 1, 1, 1, 1, 1, 1,
1, 1, 1, 1, 1, 1, 1, 1, 1, 1, 1, 1, 1, 1, 1, 1, 1, 1, 1, 1, 1, 1, 
1, 1, 1, 1, -1, -1, -1, -1, -1, -1, -1, -1, -1, -1, -1, -1, -1, -1, \
-1, -1}, LabelStyle -> 
Directive[FontFamily -> "Times New Roman", Plain, FontSize -> 11], 
PlotLegends -> {Subscript[Style["t", Bold], Style[p, Plain]] -> 
Style["F", Bold] <> "\[Congruent]" <> Style["I", Bold]}, 
PlotRange -> Automatic, AxesLabel -> {"\!\(\*
StyleBox[SubscriptBox[
StyleBox[\"e\",\nFontWeight->\"Plain\"], \"i\"],\nFontWeight->\"Plain\
\"]\)", "\!\(\*SubscriptBox[\(t\), \(i\)]\)"}]

My question is: How can I format the plot legend such that "t" is bold, p is the subscript of "t", and also "F" and "I" are bold?

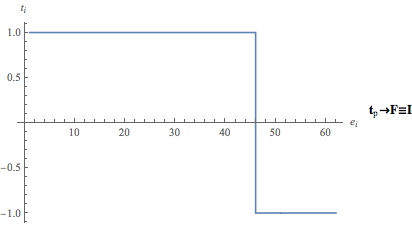
$\endgroup$
2
  • 1
    $\begingroup$ Possible duplicate of How to join two Style[]d strings $\endgroup$
    – MassDefect
    Commented May 13, 2019 at 16:33
  • $\begingroup$ Also, you currently only have a single list of numbers which means only one legend (the blue one) will be displayed. If you want two legends to display, you should have something like ListStepPlot[{{1, 1, 1, 1, 1, 1, ...}, list2},...]. $\endgroup$
    – MassDefect
    Commented May 13, 2019 at 16:36

1 Answer 1

1
$\begingroup$

I suggest you use Row for your plot legend. Like so:

ListStepPlot[ConstantArray[1, 45]~ Join~ ConstantArray[-1, 16], 
  LabelStyle -> Directive[FontFamily -> "Times New Roman", FontSize -> 11],
 PlotLegends ->
   Style[Row[{Subscript["t", Style[p, Plain]], "→", "F", "≡", "I"}], Bold, "TR"],
   PlotRange -> Automatic,
   AxesLabel -> {Subscript[e, i], Subscript[t, i]}]

plot

$\endgroup$

Your Answer

By clicking “Post Your Answer”, you agree to our terms of service and acknowledge you have read our privacy policy.

Not the answer you're looking for? Browse other questions tagged or ask your own question.