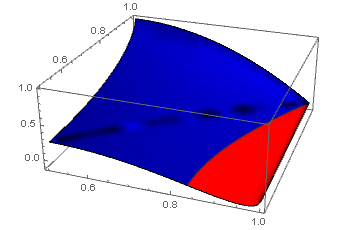
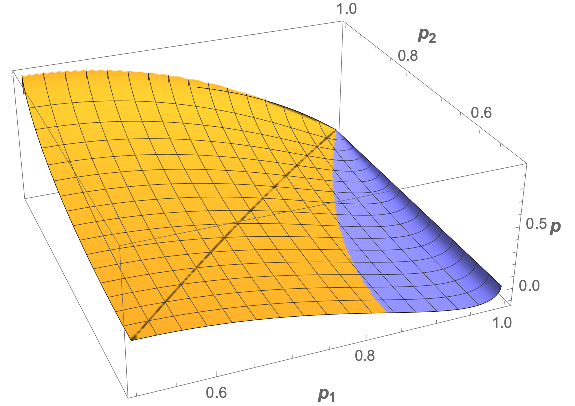
In the Plot3D generated by the code below, I would like to indicate the region below 0 with a different color. How can this be done?
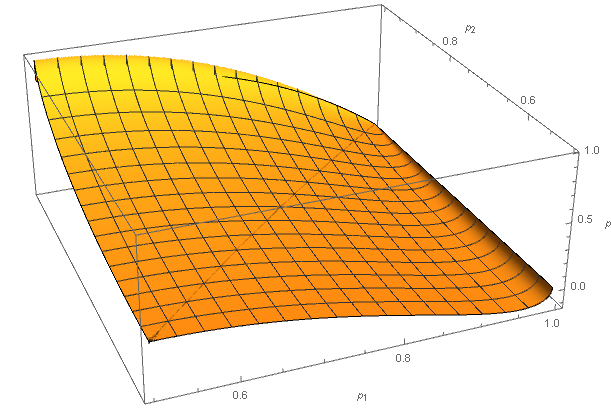
EDIT: and can the problem be solved while keeping a look/feel like the image below?
Plot3D[If[p1 == p2, -(-1 + p1) p1, ((1 - p1) p1 (-128 ((1 - p1) p1)^(3/2) (-1 +p2)^2 p2^2 + (384 (-1 + p1)^3 p1^3)/Sqrt[1/(p2 - p2^2)] + 128 Sqrt[(1 - p1) p1] (-1 + p2)^3 p2^3 (-3 + 2 Sqrt[((-1 + p2) p2)/((-1 + p1) p1)]) + 128 Sqrt[1/(p1 - p1^2)] (3 (-1 + p1) p1 (-1 + p2)^3 p2^3 - (-1 + p2)^4 p2^4 + (2 ((1 - p2) p2)^(7/2))/Sqrt[1/(p1 - p1^2)] + ((-1 + p2)^4 p2^4)/(((-1 + p2) p2)/((-1 + p1) p1))^(3/2) + 3 (-1 + p1)^4 p1^4 Sqrt[((-1 + p2) p2)/((-1 + p1) p1)] - 6 (-1 + p1)^4 p1^4 (((-1 + p2) p2)/((-1 + p1) p1))^(3/2)) + 4 (1 - p1) p1 (-128 ((1 - p2) p2)^(5/2) - 96/(1/(p2 - p2^2))^(5/2)) + 256 (-1 + p1)^2 p1^2 (((1 - p2) p2)^(3/2) + 3/(1/(p2 - p2^2))^(3/2))))/(64 (p1 - p2)^2 ((1 - p2) p2)^(3/2) (-1 + p1 + p2)^2)], {p1, 0.5, 1}, {p2, 0.5, 1}, Exclusions -> None]


