2
$\begingroup$
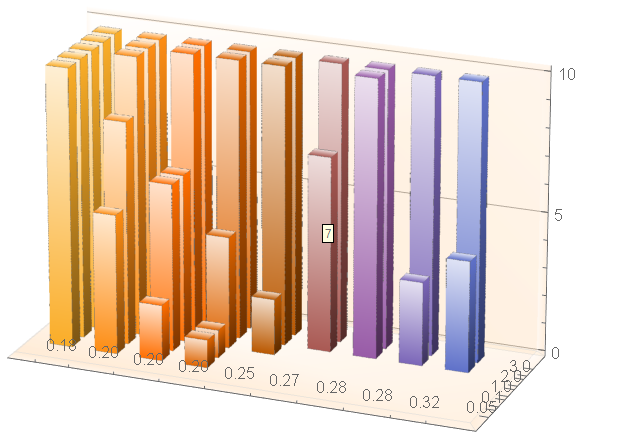
data = {{10,5,2,1,Missing[],Missing[],Missing[],Missing[],Missing[]},{10,8,6,1,Missing[],Missing[],Missing[],Missing[]},{10,10,6,4,2,Missing[],Missing[],Missing[],Missing[]},{10,10,10,10,10,7,10,3,4},{10,10,10,10,10,10,10,10,10}};

BarChart3D[data,
BarSpacing-> {1,0.5}, 
ChartLayout-> "Grid",
ChartLabels ->{{"0.05","0.1","1.0","2.0","3.0"},{" 0.18","0.20","0.20","0.20","0.25","0.27","0.28","0.28","0.32"}},
TicksStyle ->{False,False,True},
ViewPoint-> {3.33,-8.26,3.36},
ImageSize->Large]

If you plot this code, on the y-axis chart labels will be on top of one another. How would I go about resolving this?

Is there any way to increase the resolution of the graph?

$\endgroup$

1 Answer 1

1
$\begingroup$

Problem #1 - one array in data has fewer elements than the others. Problem #2 - Whether it's a bug or not, BarChart3D isn't working well with Missing[].

If I understand the problem correctly, you can work around the overlapping tick labels by deleting instances of Missing. Assuming that data cannot change (or you want the Missing[] elements in for other purposes):

BarChart3D[DeleteCases[data, _Missing, 2], BarSpacing -> {1, 0.5}, 
 ChartLayout -> "Grid", 
 ChartLabels -> {{"0.05", "0.1", "1.0", "2.0", "3.0"}, {" 0.18", 
    "0.20", "0.20", "0.20", "0.25", "0.27", "0.28", "0.28", "0.32"}}, 
 TicksStyle -> {False, False, False}, 
 ViewPoint -> {3.33, -8.26, 3.36}, BaseStyle -> FontSize -> 16, 
 ImageSize -> Large]

enter image description here

$\endgroup$

Your Answer

By clicking “Post Your Answer”, you agree to our terms of service and acknowledge you have read our privacy policy.

Not the answer you're looking for? Browse other questions tagged or ask your own question.