0
$\begingroup$

I have a list of $ (x, y) $, say {{x1, y1}, {x2, y2}, ..., {x1000, y1000}} and would like to make a density plot.

I understand that I may categorize the data into different groups first, and count the number of element in each group, then make a ListDensityPlot.

I would like to ask if there is other faster way to do it, or any built-in function can be used?

Thank you!

$\endgroup$
3
  • 2
    $\begingroup$ It sounds like you are talking about a histogram rather than density plot. Histogram3D should plot your list as it is (without having to gather it into counts) $\endgroup$
    – bill s
    Commented Dec 12, 2018 at 3:04
  • 5
    $\begingroup$ Try SmoothDensityHistogram. $\endgroup$ Commented Dec 12, 2018 at 3:30
  • $\begingroup$ How about showing some sample data and the desired plotting? $\endgroup$ Commented Dec 12, 2018 at 3:52

1 Answer 1

2
$\begingroup$
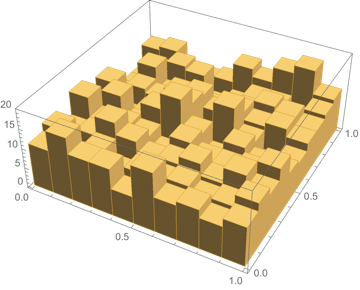
Histogram3D[Table[RandomReal[{0, 1}, {2}], {1000}]]

enter image description here

which takes $0.078$ seconds.

$\endgroup$

Your Answer

By clicking “Post Your Answer”, you agree to our terms of service and acknowledge you have read our privacy policy.

Not the answer you're looking for? Browse other questions tagged or ask your own question.