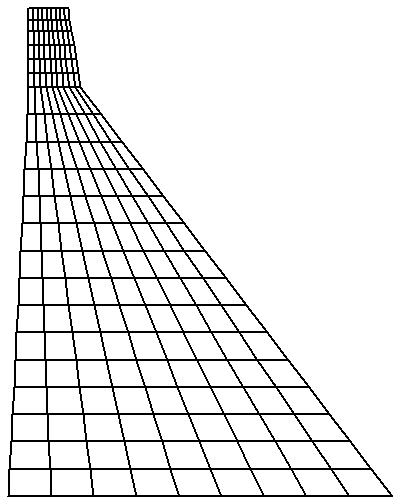
I made a finite element code and I want to show the stress distribution over the domain. The domain is shown below and I know the value of the data at the middle of each quadrilateral element.
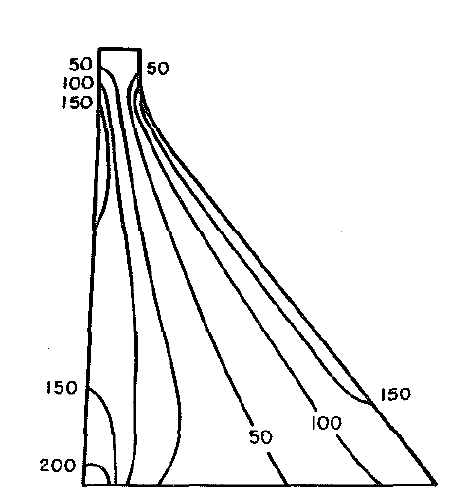
I can use Graphics and assign a color to each quadrilateral depending on the intensity of the stress at each point but the visualization will not look very nice since the quadrilaterals are not small (I can make them smaller but the program will take longer time to compute the data). I want to use a function like ListContourPlot to obtain smooth contour plots for the stress distribution, something like the picture below with colors for each band:
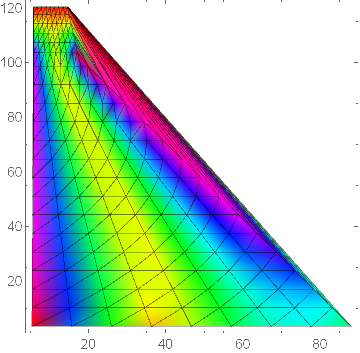
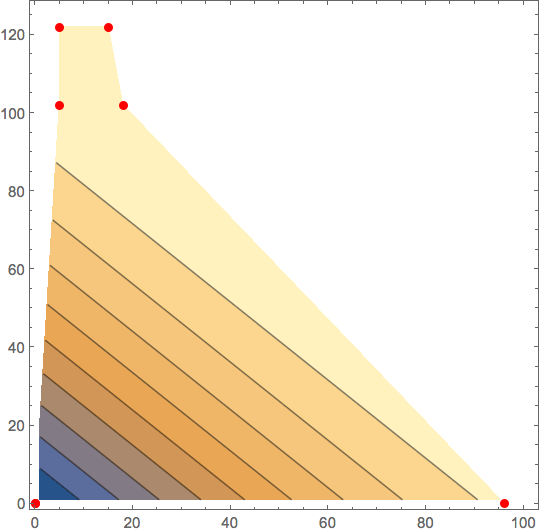
Is it possible to use ListContourPlot or ListDensityPlot and visualize the data variation over the domain shown in the figure below? From reading the manual for both these functions it's not possible to define such domain (Polygon). And if I use the functions without assigning the domain I obtain something like this, which is not exactly the domain:
What can be done? Thank you.


ListContourPlottakes the optionRegionFunction$\endgroup$