3
$\begingroup$

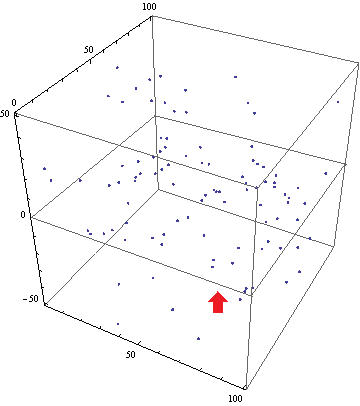
How to best draw an additional box boder at {x, y, 0} as indicated by the red arrow below? PlotRange is Automatic (do not assume it is {{0, 100}, {0, 100}, {-50, 50}} always).

enter image description here

points = RandomReal[100, {100, 3}];
points[[All, 3]] = points[[All, 3]] - 50;
ListPointPlot3D[points, BoxRatios -> 1]

The only idea I have is extracting PlotRange with AbsoluteOptions and drawing the box border manually. That may be too difficult for me. I use Mathematica 9.

$\endgroup$

2 Answers 2

3
$\begingroup$

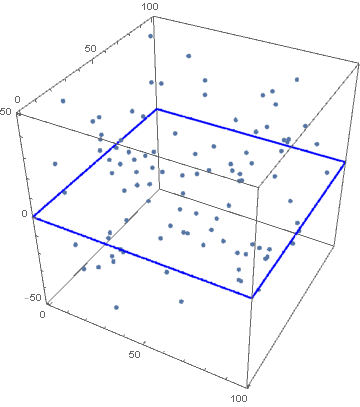
You can use InfinitePlane without having to get the PlotRange of input plot:

Show[ListPointPlot3D[points, BoxRatios -> 1],
 Graphics3D[{Opacity[0], EdgeForm[{Blue, Thick}], 
   InfinitePlane[{{0, 0, 0}, {0, 1, 0}, {1, 1, 0}}]}]]

enter image description here

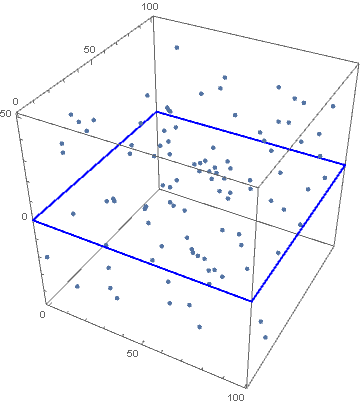
Update: An alternative that also works in version 9 is to use FaceGrids:

facegrids = {#, {{}, {0}}} & /@ Join[#, -#] &@Most[IdentityMatrix[3]];
ListPointPlot3D[points, BoxRatios -> 1, FaceGrids -> facegrids, 
 FaceGridsStyle -> Directive[Thick, Blue]]

enter image description here

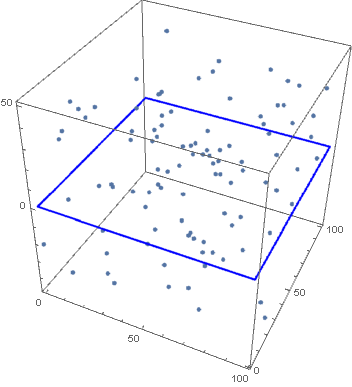
Update 2: You can also use PlotRange to extract the plot range of a plot object and use it with Cuboid:

lpp = ListPointPlot3D[points, BoxRatios -> 1]; 
rectangle = Transpose[Append[PlotRange[lpp][[;; 2]], {0, 0}]];
Show[lpp, Graphics3D[{Opacity[0], EdgeForm[{Thick, Blue}], Cuboid @@ rectangle}]]

enter image description here

$\endgroup$
3
  • $\begingroup$ Something like this I was hoping for, thanks. Unfortunately InfinitePlane was only introduced in MMA 10. $\endgroup$
    – u17
    Commented Nov 28, 2018 at 19:42
  • $\begingroup$ @Frank, please see the update. $\endgroup$
    – kglr
    Commented Nov 28, 2018 at 20:01
  • $\begingroup$ That's truly fantastic. $\endgroup$
    – u17
    Commented Nov 28, 2018 at 20:15
2
$\begingroup$

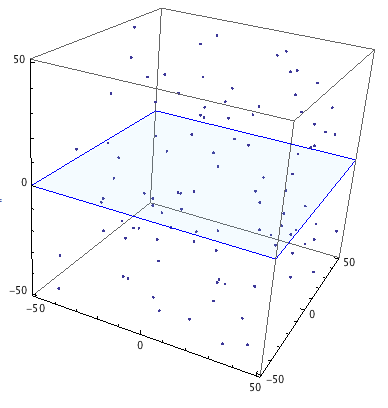
You can use the useful-but-undocumented function Charting`get3DPlotRange to find the plot range, and use that to make your box:

points = RandomReal[{-50, 50}, {100, 3}];
plot = ListPointPlot3D[points, BoxRatios -> 1];
{x, y, z} = Charting`get3DPlotRange @ plot;
Show[plot,
    Graphics3D[
        {
            EdgeForm @ Blue,
            FaceForm @ Opacity @ 0.05, (* set to 0 for transparent *)
            Cuboid @@ Thread[{x, y, {0, 0}}]
        }
    ]
] 

enter image description here

$\endgroup$
1
  • $\begingroup$ Thanks! I ran into trouble when using this together with PlotLegends -> Placed[]. $\endgroup$
    – u17
    Commented Nov 28, 2018 at 20:16

Your Answer

By clicking “Post Your Answer”, you agree to our terms of service and acknowledge you have read our privacy policy.

Not the answer you're looking for? Browse other questions tagged or ask your own question.