I have the following code that produces a plot of a Normal distribution:
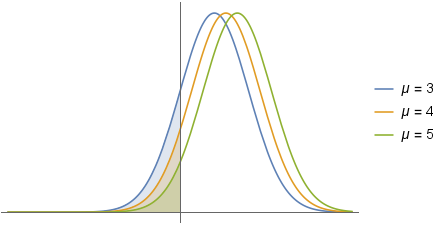
Plot[Table[PDF[NormalDistribution[μ, 3], x], {μ, {4}}] // Evaluate, {x, -15, 15},
 Filling -> None, Axes -> {True, True}, Ticks -> None,
 PlotStyle -> {RGBColor[0.368417, 0.506779, 0.709798],
  RGBColor[0.880722, 0.611041, 0.142051]}]
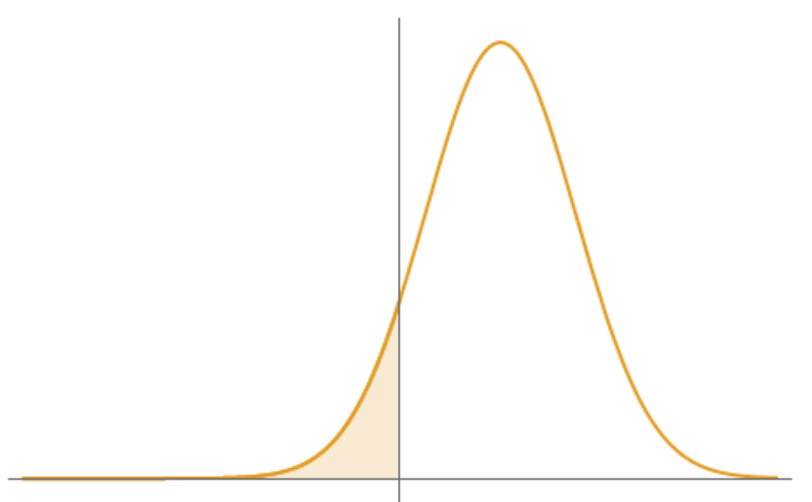
How do I fill to the left of the y-axis only?


