1
$\begingroup$

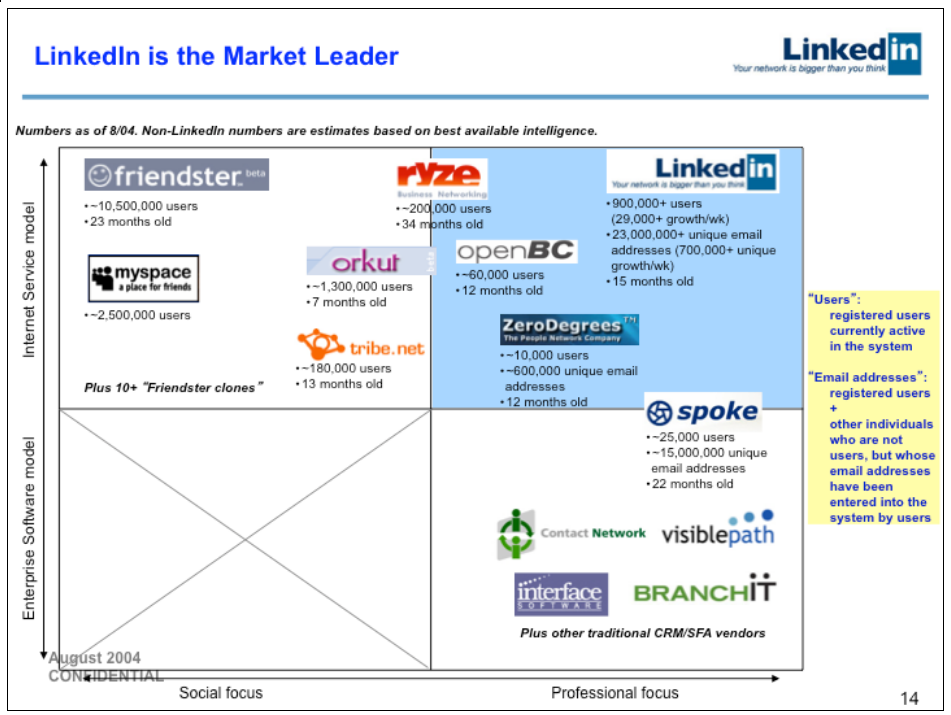
Question: Is there a way to create a graph similar to the one below?

enter image description here

Some ideas:

  • Each business is a point on the plane $[0,1] \times [0,1]$.

  • Each point on the plane can be represented as an image in Mathematica (I assume).

Attempt: Perhaps a good place to start is ListPlot

ListPlot[{1, 1, -1} -> {"Freindster", "LinkedIn", "Interface Software"}]

Here's not clear how to (i) add pictures as labels; (ii) add commentary and (iii) let the X-axis range from $-1$ to $1$ as in the LinkedIn graph.

$\endgroup$
7
  • 2
    $\begingroup$ Show us what you've tried so far and what you have problems with. $\endgroup$
    – corey979
    Commented Aug 8, 2018 at 21:33
  • $\begingroup$ Wow, Friendster? And it was in beta? Is this picture from the 1960's or something? $\endgroup$
    – march
    Commented Aug 8, 2018 at 23:26
  • $\begingroup$ @march, 2004 if I'm reading ourstory.linkedin.com correctly. $\endgroup$ Commented Aug 9, 2018 at 1:32
  • $\begingroup$ george, you might want to post an image without the "CONFIDENTIAL" marking. $\endgroup$
    – kglr
    Commented Aug 9, 2018 at 6:20
  • $\begingroup$ @kglr May be the "CONFIDENTIAL" marking as one of question's requirements. $\endgroup$ Commented Aug 9, 2018 at 12:58

0

Browse other questions tagged or ask your own question.