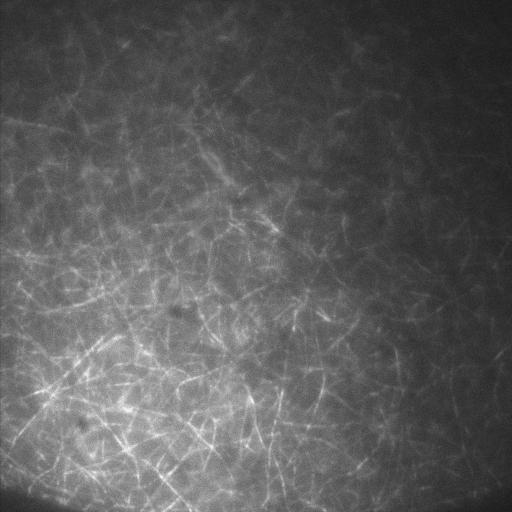
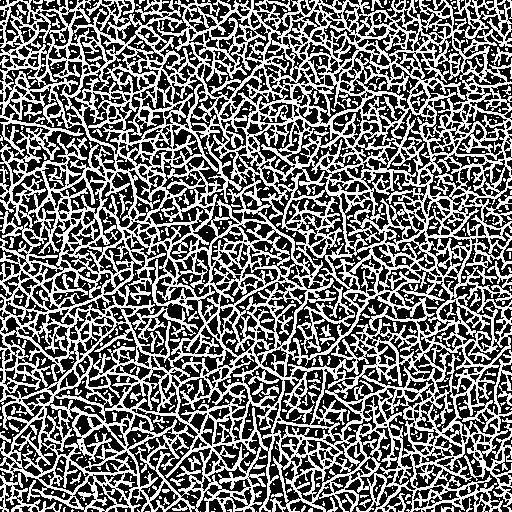
I have a microscope image of actin filaments and I'd like to extract the geometry of the bright lines into a Graph object:
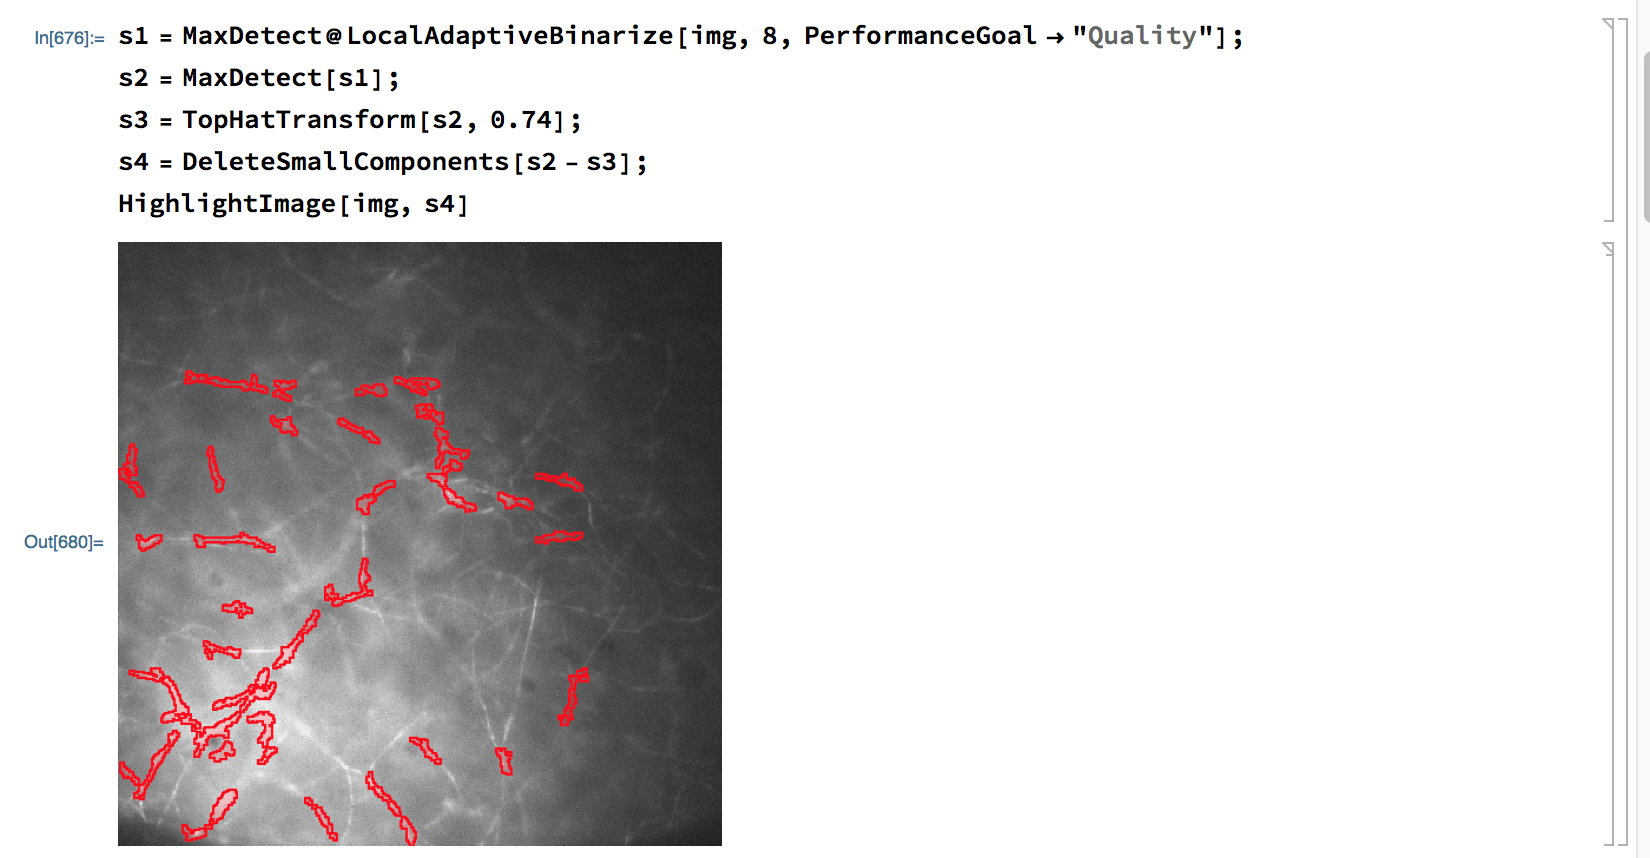
Here's what I have so far, using the above image as img:
s1 = MaxDetect@
   LocalAdaptiveBinarize[img, 8, PerformanceGoal -> "Quality"];
s2 = MaxDetect[s1];
s3 = TopHatTransform[s2, 0.74];
s4 = DeleteSmallComponents[s2 - s3];
HighlightImage[img, s4]
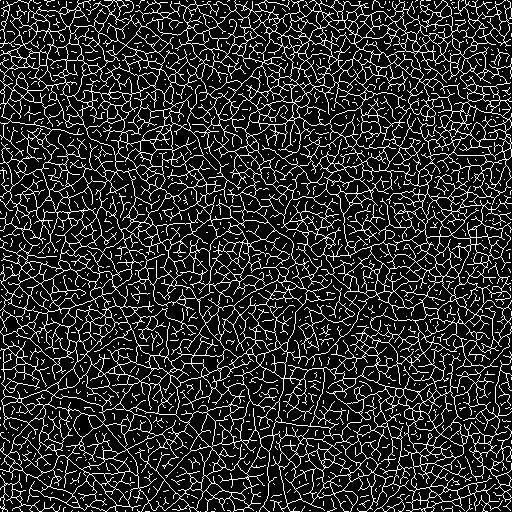
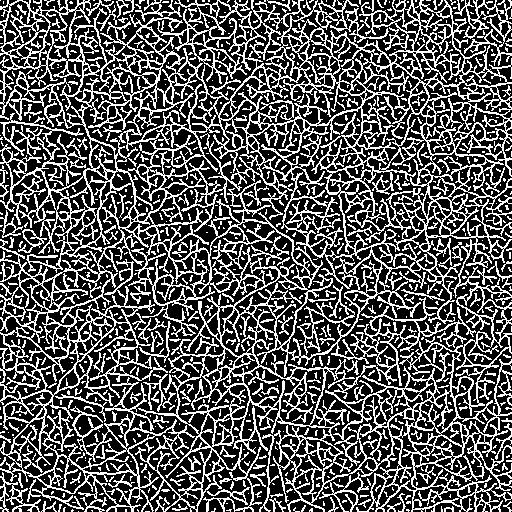
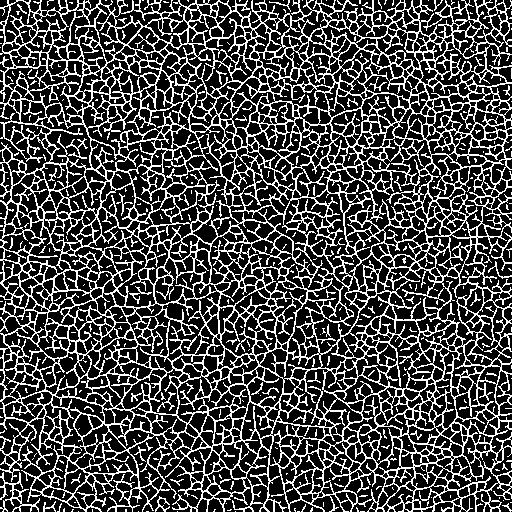
But this misses lots of lines and the output isn't really a skeleton.
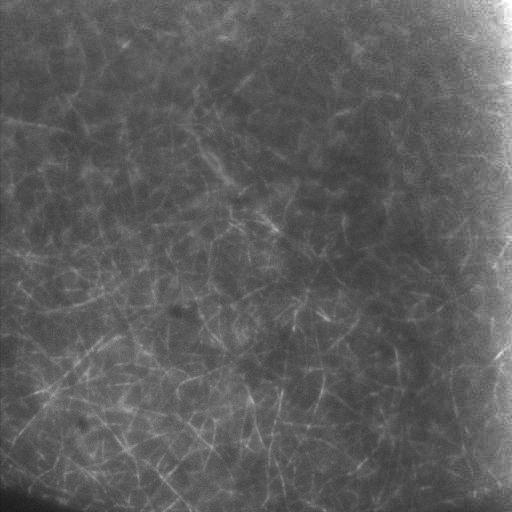
Here are a few more example images of the cytoskeleton to try this on:
example1 = CloudGet["https://www.wolframcloud.com/objects/defc77bb-8218-4660-9fb2-d851c1145cae"]
example2 = CloudGet["https://www.wolframcloud.com/objects/b44045ec-f7ce-4db0-82bf-57e86d1967ac"]

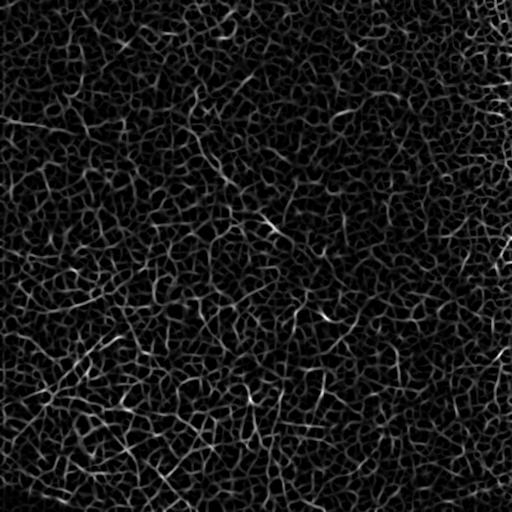
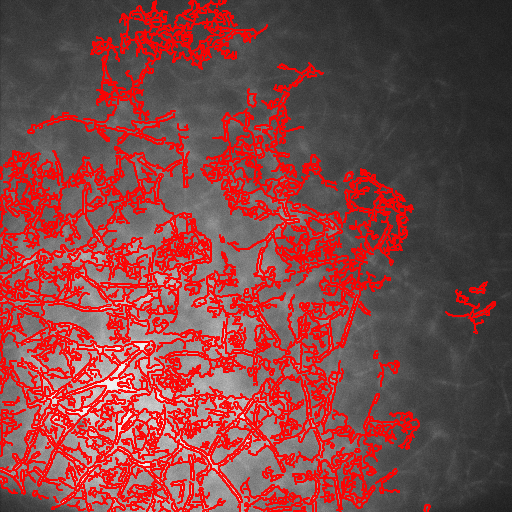
MorphologicalGraph[s1]a try... But I am afraid, that is not exactly what you look for. $\endgroup$