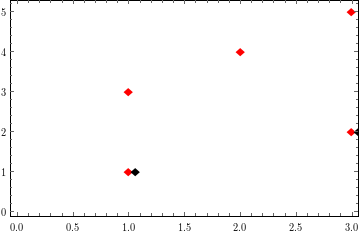
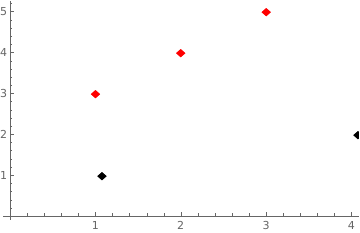
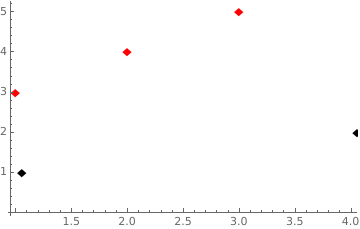
simple plot of two lists, of which one contains infinity (markers are slightly shifted):
ListPlot[
    {{3, 4, 5},{1, Infinity, 2}},
    PlotMarkers -> {{"\[FilledDiamond]", 13}, {"   \[FilledDiamond]", 13}},
    PlotStyle -> {Red, Black}
]
What I get is this:
Note the duplicate red points for each black point!
This definitely doesn't seem right, can someone confirm that?
My current workaround is to just replace all Infinitys with a low number and then adjust the PlotRange.
Update: I contacted the Mathematica Technical Support Team, which confirmed the bug and said they'd work on that. In the meantime, there's plenty of workarounds, so I marked the question as solved.
Cheers


[bugs]tag to confirmed bugs, but I believe the situation is pretty clear and the example is simple enough to assume that what happens here is not OK. @kuropan, Would you consider reporting this to Wolfram, so that they are aware of this issue? $\endgroup$PlotMarkers. They have been fixed, and will be available in a future release. $\endgroup$