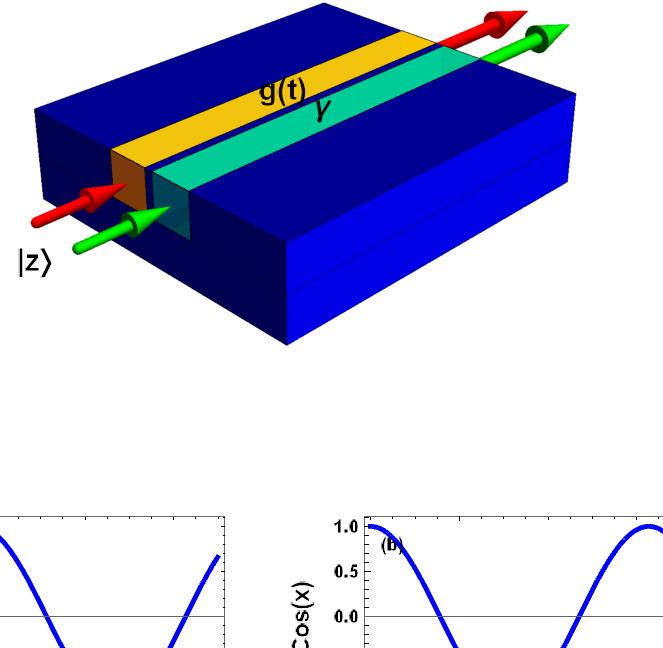
I have tried to combine a graph with two plots, but some parts of figure are missing after the combination. I have tried to fix it by changing the image size, but it did not work (by the way, since it is going to appear in a journal, if the size is small, it's resolution won't be enough for publication, especially for jepg files).
The graphics code is here:
g1 = Graphics3D[
{Green, Arrowheads[0.05],
Arrow[Tube[{{-6, 2.9, .5}, {-4, 2.9, .5}}, 0.1]]}, Boxed -> False,
ImageSize -> 1500];

g2 = Graphics3D[
{Green, Arrowheads[0.07],
Arrow[Tube[{{4, 2.9, .5}, {8, 2.9, .5}}, 0.15]]}, Boxed -> False,
ImageSize -> 1500];

g3 = Graphics3D[
{Red, Arrowheads[0.05],
Arrow[Tube[{{-6, 4.1, .5}, {-4, 4.1, .5}}, 0.1]]}, Boxed -> False,
ImageSize -> 1500];

g4 = Graphics3D[
{Red, Arrowheads[0.07],
Arrow[Tube[{{4, 4.1, .5}, {8, 4.1, .5}}, 0.15]]}, Boxed -> False,
ImageSize -> 1500];

g5 = Graphics3D[
{{EdgeForm[{Thickness[.000001], GrayLevel@0}], RGBColor[0, 0, 1],
 Cuboid[{-4, 0, 0}, {4, 2.4, 1}],
 Text[Style["|z\[RightAngleBracket]", 20, Black, Bold], {-8, 1,
   2}]},
{EdgeForm[{Thickness[.000001], GrayLevel@0}], Blue,
 Cuboid[{-4, 3.4, 0}, {4, 3.6, 1}]},
{EdgeForm[{Thickness[.000001], GrayLevel@0}], Blue,
 Cuboid[{-4, 4.6, 0}, {4, 7, 1}]},
{EdgeForm[{Thickness[.000001], GrayLevel@0}], Blue,
 Cuboid[{-4, 0, 0}, {4, 7, -1}]},
{Cyan, Opacity[.95], Cuboid[{-4, 2.4, 0}, {4, 3.4, 1}],
 Text[Style["\[Gamma]", 20, Black, Bold], {0, 3.1, 1}]},
{Yellow, Opacity[.95], Cuboid[{-4, 3.6, 0}, {4, 4.6, 1}],
 Text[Style["g(t)", 20, Black, Bold], {0, 4.2, 1}]}},
Boxed -> False, ImageSize -> 1500];

f1 = Show[{g1, g2, g3, g4, g5}, ViewPoint -> {-1, -1, .7}]
As an example, suppose we want to add sine and cosine plots to the graph. So,
f2 = GraphicsRow[{Plot[Sin[x], {x, 0, 7}, GridLines -> None,
PlotStyle -> {Thickness[0.015], Blue},
FrameLabel -> {Style["x", FontSlant -> Italic], "Sin(x)"},
FrameTicksStyle -> {Directive[Black, 12], Directive[Black, 12]},
LabelStyle -> {Bold, Directive[Black, 16]}, Frame -> True,
PlotRange -> All,
Epilog -> {Text[Style["(a)", Bold, 12], {.5, .8}]}],

Plot[Cos[x], {x, 0, 7}, GridLines -> None,
PlotStyle -> {Thickness[0.015], Blue},
FrameLabel -> {Style["x", FontSlant -> Italic], "Cos(x)"},
FrameTicksStyle -> {Directive[Black, 12], Directive[Black, 12]},
LabelStyle -> {Bold, Directive[Black, 16]}, Frame -> True,
PlotRange -> All,
Epilog -> {Text[Style["(b)", Bold, 12], {.5, .8}]}]}]
Since I didn't want the white margin of the final figure, I tried the following code (I used this link: Remove the white margins of a Graphics3D figure):
GraphicsColumn[{f1, f2}, Spacings -> -180,
Method -> {"ShrinkWrap" -> True}]
The result is here:
So, how can I avoid chopping the figure while the resolution is acceptable (I tried bigger image sizes, but in that case no part of the plot appeared!


Method -> {"ShrinkWrap" -> True}toShowthat producesf1(not toGraphicsColumn) $\endgroup$