10
$\begingroup$

My grandson and I are trying to plot Sin[x] and Sin[x + pi/2] on the same axis.

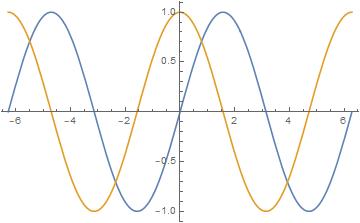
Sin[x + pi/2] should be similar in magnitude and frequency to the Sin[x] curve, but shifted pi/2 to the left. The problem is that Mathematica is converting Sin[x + pi/2] to Cos[x]. When we try to plot these together, we get the following:

Enter image description here

As you can see, the Sin[x + pi/2] (now Cos[x]!) represented by the light-brown curve is centered at the y-axis, instead of being shifted pi/2 to the left. Also, the Sin[x] curve has been shifted to the right instead of being centered on the y-axis.

Why is this happening? Why is Mathematica converting Sin[x + Pi/2] to Cos[x]? Also, wouldn't you expect the Sin[x] curve (in blue) to also be centered on the y-axis?

Here's our code:

 y1[x_] := Sin[x];
 y2[x_] := Sin[x + Pi/2];
 a = -2 Pi; b = 2 Pi;
 Plot[{y1[x], y2[x]}, {x, a, b}]

Instead of Pi we have the symbol for pi in our actual code.

$\endgroup$
8
  • 8
    $\begingroup$ "Sin[x + Pi/2] should be similar in magnitude and frequency to the Sin[x] curve but shifted Pi/2 to the left": ... and indeed it is! The yellow curve (Sin[x + Pi/2]) is the same as the blue curve, only shifted to the left by Pi/2. Coincidentally, Sin[x + Pi/2] is also equal to Cos[x], but that is neither here nor there with respect to your issue; indeed, Sin and Cos differ in phase by exactly Pi/2. What am I missing here? $\endgroup$
    – MarcoB
    Commented Jun 21, 2018 at 18:08
  • 6
    $\begingroup$ Secondarily, wouldn't you expect the Sin[x] curve (in blue ) to also be centered on the y-axis?: no, I wouldn't, since $\sin{0}=0$. Are you perhaps misunderstanding the colorings? Would adding PlotLegends -> "Expressions" help in clarifying here? $\endgroup$
    – MarcoB
    Commented Jun 21, 2018 at 18:12
  • 3
    $\begingroup$ So very sorry...Grandpa is a moron! The curves are actually where they are supposed to be [Cos(0) = 1 & Sin(0) = 0]. The true question is: Why is MM converting the original expression to Cos[x]? Which was answered by several of you! Thanks! $\endgroup$
    – OilerMan
    Commented Jun 21, 2018 at 18:23
  • 9
    $\begingroup$ @OilerMan No worries whatsoever. You and grandson are doing great :-) $\endgroup$
    – MarcoB
    Commented Jun 21, 2018 at 18:24
  • 5
    $\begingroup$ This is why I love this place: It is rare in the internet, that such a question would be answered as polite as here :) $\endgroup$
    – DPF
    Commented Jun 22, 2018 at 6:45

3 Answers 3

27
$\begingroup$

The reason why Sin[x+Pi/2] is converted to Cos[x] is, that it is the simplest form. This is the way Mathematica works. You input an expression and Mathematica tries to normalize it as much as possible by applying rules that are coded into the system. There are many many rules and more importantly, often you wouldn't recognize them as transformations of expressions. What about this

Plus[1, 1]
(* 2 *)

I hope you agree that you wouldn't complain about this transformation. In your case, it is exactly the same although it is not as obvious as 1+1. Cos[x] is just the best form Mathematica could find after applying the rules of the system.

Also, wouldn't you expect the Sin[x] curve (in blue ) to also be centered on the y-axis?

That is a question I don't understand, but Sin[x] just looks this way. Maybe you can clarify this a bit.

$\endgroup$
25
$\begingroup$

Sin[x + Pi/2] can be written in an easier way due to mathematical formula:

$\sin(a + b) = \sin(a)\cos(b) + \sin(b)\cos(a)$

Here, $a = x$ and $b = \pi/2$. You need to know that $\sin(\pi/2) = 1$ and $\cos(\pi/2) = 0$.

So you rewrite with the formula:

$\sin(x + \pi/2) = \sin(x)\cos(\pi/2) + \sin(\pi/2)\cos(x)$

$= \sin(x)\cdot 0 + 1\cdot \cos(x)$

$= \cos(x)$

Mathematica just uses a simpler form but both expressions are exactly the same.

$\endgroup$
1
  • 4
    $\begingroup$ Welcome to Mathematica.SE! Really nice that you started off by answering instead of asking a question. If you are unsure about the etiquette, feel free to take the introductory Tour. If you have any other question about the site and how everything works, feel free to visit the Mathematica Chat and say hello. $\endgroup$
    – halirutan
    Commented Jun 22, 2018 at 0:01
12
$\begingroup$

I don't think the issue here is Mathematica at all; rather, I think you are confused about what the graph of $y=\sin x$ is supposed to look like.

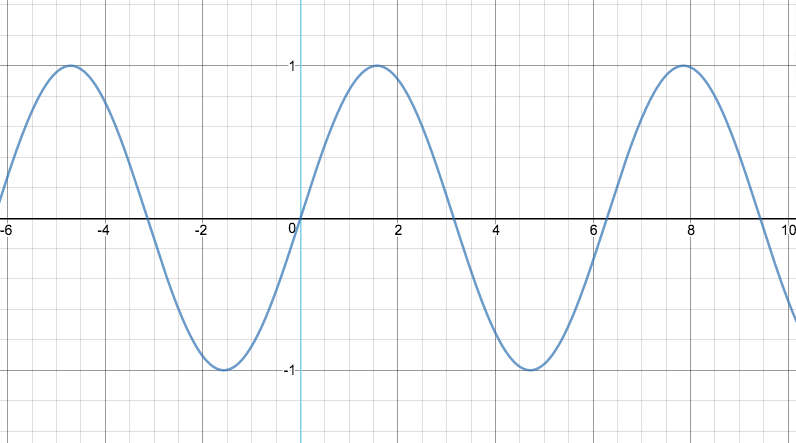
The function $y=\sin x$ is not "centered on the $y$-axis"; rather, it has odd symmetry, i.e. $180^\circ$ rotational symmetry around the origin. $y=\sin x$ is shown below: enter image description here

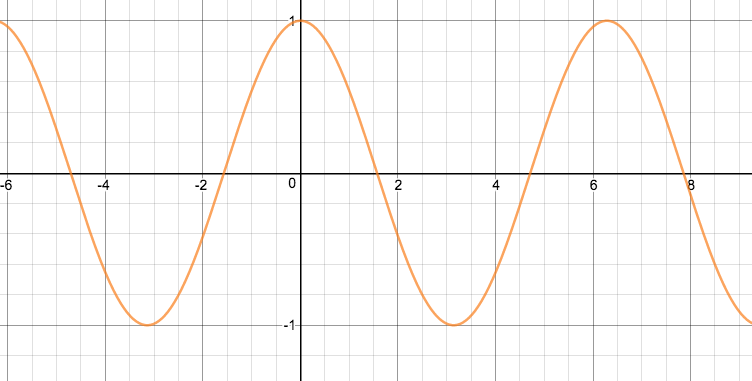
The graph of $y=\sin (x + \pi/2)$ is the same as $y=\sin x$ but shifted $\pi/2$ units (i.e. one-quarter period) to the left, which has the effect of moving the maximum to the $y$-axis: enter image description here

This function, unlike the "unshifted" version, is symmetric across the $y$-axis. And it also happens to be completely identical with the function $y=\cos x$, which has even symmetry.

So now go back to the original graph you included in your post. The blue curve, $y=\sin x$, has not "been shifted to the right instead of being centered on the y-axis". It's right where it's supposed to be, and should not be centered on the $y$-axis. When you do shift it to the left, then it ends up centered on the $y$-axis, and exactly equal to the cosine function.

$\endgroup$
1
  • $\begingroup$ I guess you did not see my comment above. You are absolutely correct! $\endgroup$
    – OilerMan
    Commented Jun 22, 2018 at 4:29

Your Answer

By clicking “Post Your Answer”, you agree to our terms of service and acknowledge you have read our privacy policy.

Not the answer you're looking for? Browse other questions tagged or ask your own question.