My grandson and I are trying to plot Sin[x] and Sin[x + pi/2] on the same axis.
Sin[x + pi/2] should be similar in magnitude and frequency to the Sin[x] curve, but shifted pi/2 to the left. The problem is that Mathematica is converting Sin[x + pi/2] to Cos[x]. When we try to plot these together, we get the following:
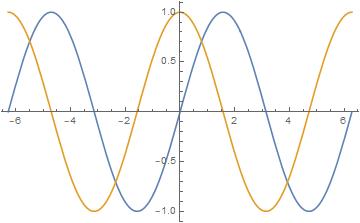
As you can see, the Sin[x + pi/2] (now Cos[x]!) represented by the light-brown curve is centered at the y-axis, instead of being shifted pi/2 to the left. Also, the Sin[x] curve has been shifted to the right instead of being centered on the y-axis.
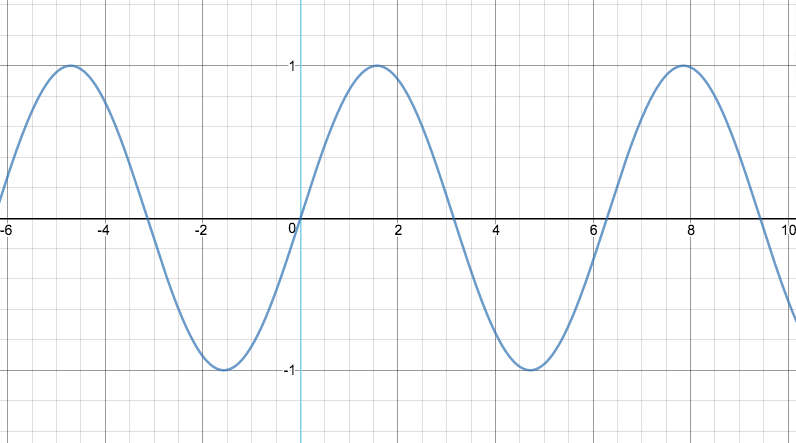
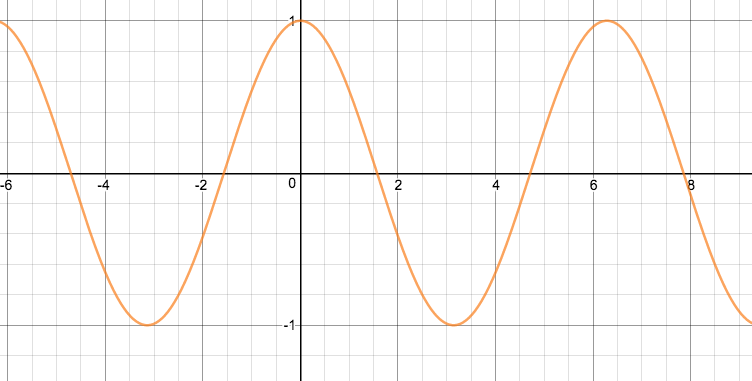
Why is this happening? Why is Mathematica converting Sin[x + Pi/2] to Cos[x]? Also, wouldn't you expect the Sin[x] curve (in blue) to also be centered on the y-axis?
Here's our code:
 y1[x_] := Sin[x];
 y2[x_] := Sin[x + Pi/2];
 a = -2 Pi; b = 2 Pi;
 Plot[{y1[x], y2[x]}, {x, a, b}]
Instead of Pi we have the symbol for pi in our actual code.


Sin[x + Pi/2]should be similar in magnitude and frequency to theSin[x]curve but shifted Pi/2 to the left": ... and indeed it is! The yellow curve (Sin[x + Pi/2]) is the same as the blue curve, only shifted to the left by Pi/2. Coincidentally,Sin[x + Pi/2]is also equal toCos[x], but that is neither here nor there with respect to your issue; indeed, Sin and Cos differ in phase by exactly Pi/2. What am I missing here? $\endgroup$PlotLegends -> "Expressions"help in clarifying here? $\endgroup$