3
$\begingroup$

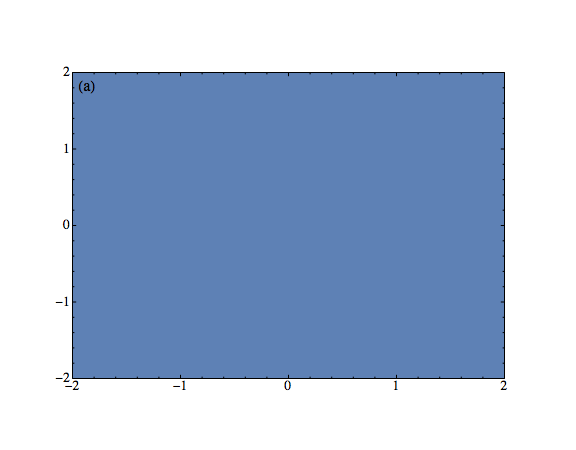
When I make a ListPlot then hand it to Multipanel, the point size gets multiplied by some huge number. Can I control the point size from within scidraw?

Here's a basic example:

(*Init SciDraw*)
AppendTo[$Path, "yourpathhere/mathematica-packages"];
Quiet[<< SciDraw`]

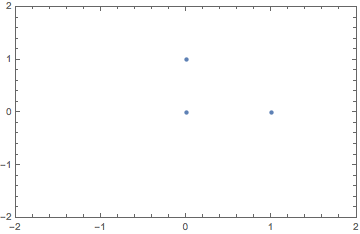
samplePlot = 
 ListPlot[{{0, 0}, {0, 1}, {1, 0}}, Axes -> False, Frame -> True, 
  PlotRange -> {{-2, 2}, {-2, 2}}]

enter image description here

DefineStyle["style", {FigurePanel -> {XPlotRange -> {-2, 2}, 
    YPlotRange -> {-2, 2}}}]
Figure[Multipanel[{
   FigurePanel[{FigGraphics[samplePlot]}, {1, 1}];
   }, Dimensions -> {1, 1}]
 , Style -> "style"]

enter image description here

$\endgroup$
5
  • 1
    $\begingroup$ samplePlot = ListPlot[{{0, 0}, {0, 1}, {1, 0}}, Axes -> False, Frame -> True, PlotRange -> {{-2, 2}, {-2, 2}}, PlotStyle -> PointSize[Medium]] works $\endgroup$ Commented Jun 19, 2018 at 18:10
  • $\begingroup$ Interesting... yours works, but using PointSize[0.015] doesn't work, despite that it looks the same in ListPlot. I think SciDraw interprets numerical values differently, but treats words like 'Medium' the same. Possibly a bug. Unfortunately in my use case I need a very specific PointSize, so that doesn't help. $\endgroup$
    – Max
    Commented Jun 19, 2018 at 19:46
  • $\begingroup$ I know of one workaround, where I use super small PointSize in my original plot to compensate SciDraw's inflation. But this is (a) tedious because it requires guess and check, and (b) only helps if you saved the data you used to make the plot (or can re-make it easily). Better solutions are still welcome. $\endgroup$
    – Max
    Commented Jun 19, 2018 at 19:49
  • 1
    $\begingroup$ related: here $\endgroup$ Commented Jun 19, 2018 at 20:01
  • $\begingroup$ @egwenesedai Thank you! With some editing, Szabolcs' solution works for me. I'll post an answer myself and credit you. $\endgroup$
    – Max
    Commented Jun 19, 2018 at 21:22

2 Answers 2

3
$\begingroup$

@egwenesedai linked me to this answer by @Szabolcs which addresses the weirdness of this behavior and gave me 90% of a solution.

For the case of plotting points, the solution is to use

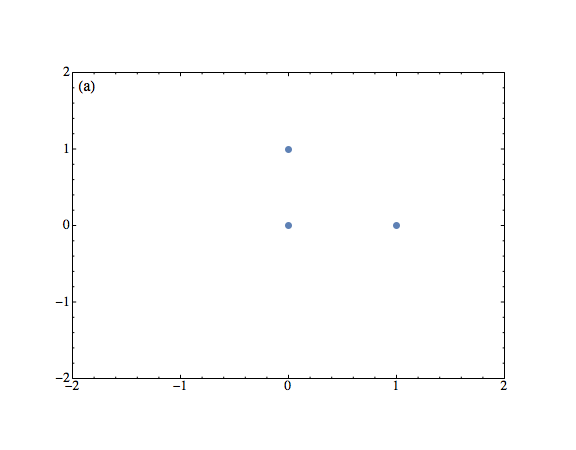
FigGraphics[samplePlot /. PointSize[s_] :> PointSize[0.01 s]]

which, pasted into the code in the question, gives

enter image description here

In my actual use case however, I found 0.006 to be a more accurate scaling. It may depend on the plot.

$\endgroup$
1
$\begingroup$

Another workaround is to explicitly assign the point size in the original plot command PlotStyle -> (PointSize -> Automatic), for example,

samplePlot = 
 ListPlot[{{0, 0}, {0, 1}, {1, 0}}, Axes -> False, Frame -> True, 
  PlotRange -> {{-2, 2}, {-2, 2}}, 
  PlotStyle -> (PointSize -> Automatic)]

This will render SciDraw to plot regular size of points as it is in ListPlot

$\endgroup$
1
  • $\begingroup$ That’s cool to know, though as a control freak I often want to specify the size. Thanks though, upvoted. $\endgroup$
    – Max
    Commented Jul 23, 2019 at 23:12

Your Answer

By clicking “Post Your Answer”, you agree to our terms of service and acknowledge you have read our privacy policy.

Not the answer you're looking for? Browse other questions tagged or ask your own question.