1
$\begingroup$

The following code

<< SciDraw`;
Figure[
 FigurePanel[
  {FigLine[Plot[x, {x, 0, 1}]];
   p1 = {30, 80};
   p2 = DisplacePoint[p1, Canvas[{20, 20}]];
   FigInset[Show[Graphics[Circle[{0, 0}, 1]]], Transpose@{p1, p2}];
   }],
 CanvasSize -> {4, 3}
 ]

fails with

Transpose::nmtx: The first two levels of {{30,80},Object[Object$1058]}
cannot be transposed.

Why is that? The documentation claims that

The DisplacePoint function generates a new point by moving a given vector displacement “relative to” a given point. (You can actually add several displacements d1 , d2 , . . .at once.) A displacement may be given as {dx,dy}, Scaled[{dx,dy}], or Canvas[{dx,dy}]

What is the type returned by this DisplacementPoint? How can I convert it back to regular coordinates?

$\endgroup$
1
  • $\begingroup$ I didn't know the answer, but after browsing the documentation I found AnchorCoordinates. Isn't this what you need to apply to p2? No answer because I don't have the time to get to the bottom of it, but if you figure it out, please do self-answer. $\endgroup$
    – Szabolcs
    Commented Feb 8, 2017 at 12:57

1 Answer 1

2
$\begingroup$

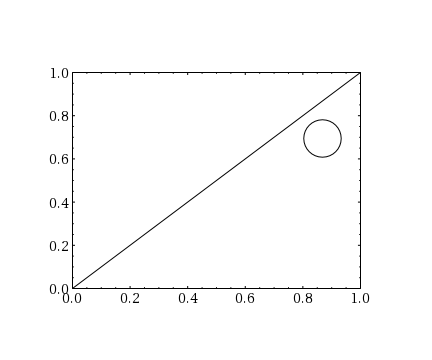
Indeed, as Szabolcs points out in the comments, AnchorCoordinates is used to convert any SciDraw points to coordinates, not just anchors. This is how it works:

Figure[
  FigurePanel[{
    FigLine[Plot[x, {x, 0, 1}]];
    p1 = {0.8, 0.6};
    p2 = DisplacePoint[p1, Canvas[{20, 20}]];
    FigInset[Show[Graphics[Circle[{0, 0}, 1]]], 
      Transpose@{p1, AnchorCoordinates[p2]}];
   }],
 CanvasSize -> {4, 3}]

enter image description here

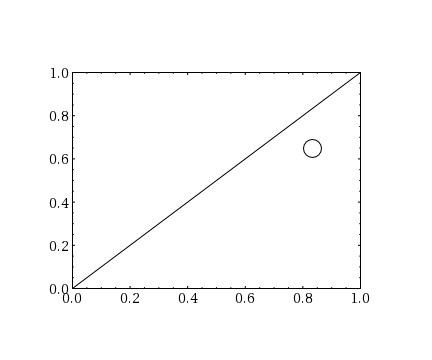
and with 40 instead of 20 pixels in Canvas[...]

enter image description here

One application for this approach is to create regions that are square on the canvas but located at given plot coordinates.

$\endgroup$

Your Answer

By clicking “Post Your Answer”, you agree to our terms of service and acknowledge you have read our privacy policy.

Not the answer you're looking for? Browse other questions tagged or ask your own question.