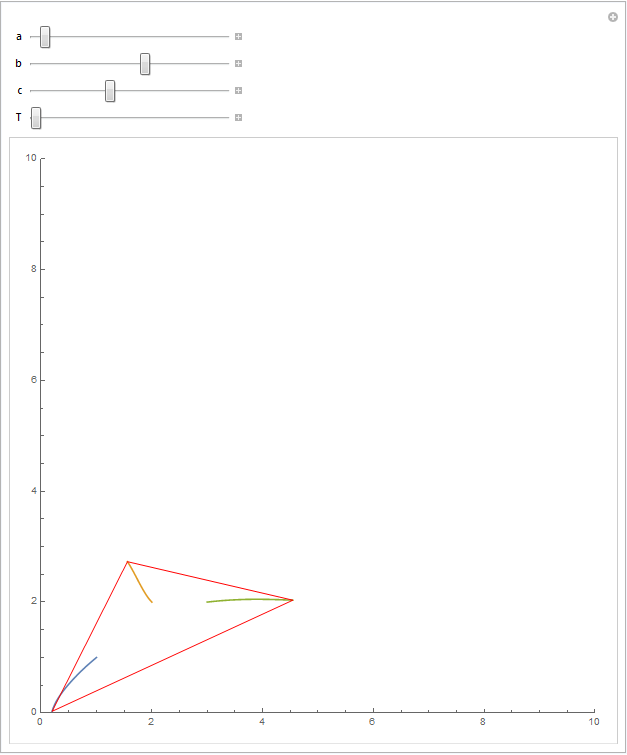
I want to determine the intermediate values of
P[i][t] = {X[i][t], Y[i][t]}
for the following system of nonlinear differential equations:
ClearAll["Global`*"]

n = 3;

P[i_][t_] = {X[i][t], Y[i][t]};

p[j_, i_] = Norm[P[i][t] - P[j][t]];

A@p[j, i] = (a*(P[i][t] - P[j][t]))/Exp[b*p[j, i]];

R@p[j, i] = (c*(P[i][t] - P[j][t]))/p[j, i]^2;

summand1 = R@p[j, i] - A@p[j, i];

A@p[i, j] = (a*(P[j][t] - P[i][t]))/Exp[b*p[i, j]];

R@p[i, j] = (c*(P[j][t] - P[i][t]))/p[i, j]^2;

summand2 = A@p[i, j] - R@p[i, j];

sys = Table[D[P[i][t], t] == Sum[If[j < i, summand1, 0], {j, 1, n}] + Sum[If[i < j, summand2,
0], {j, 1, n}] + {.1 (1/Norm[{0, Y[i][t]} - P[i][t]] - 1/Norm[P[i][t] - {10, Y[i][t]}]),
.1 (1/Norm[{X[i][t], -1} - P[i][t]] - 1/Norm[P[i][t] - {X[i][t], 3}])}, {i, 1, n}];

sol = ParametricNDSolveValue[{sys, P[1][0] == {1, 1}, P[2][0] == {2, 2}, P[3][0] == {3, 2}},
Table[P[i][t], {i, 1, n}], {t, 0, 100}, {a, b, c}];

Manipulate[ParametricPlot[sol[a, b, c] // Evaluate, {t, 0, T}, PlotRange -> {{0, 10},
{0, 10}}, ImageSize -> Large, AspectRatio -> 1], {{a, 1}, .1, 5}, {{b, 1}, .1, 5},
{{c, 1}, .1, 5}, {{T, 1}, .1, 100}]
My goal is to draw lines between each pair
P[i][t], P[j][t]
for $i \neq j$. Basically, my goal is drawing connections between the endpoints of the solution curves in order to visualize a certain equilibrium state (which might for example be an equilateral triangle in this case). For me it suffices to include the connections for
t = T
Is it possible to draw these lines within Manipulate?
Any tips are appreciated.

