2
$\begingroup$

I am trying to numerically solve and plot the solution curves $p_i(t) = (x_i(t),y_i(t))$ for $i = 1, 2$ and $3$ of the following system of nonlinear differential equations:

p1[t_] := {x1[t], y1[t]}

p2[t_] := {x2[t], y2[t]}

p3[t_] := {x3[t], y3[t]}

A1[a_, b_, t_] := a*(p2[t] - p1[t])*Exp[b*(p1[t] - p2[t])]*(p2[t] - p1[t])/Norm[p2[t] - p1[t]]

R1[c_, t_] := c/(p2[t] - p1[t])*(p2[t] - p1[t])/Norm[p2[t] - p1[t]]

B1[a_, b_, c_, t_] := A1[a, b, t] - R1[c, t]

A2[a_, b_, t_] :=  a*(p3[t] - p1[t])*Exp[b*(p1[t] - p3[t])]*(p3[t] - p1[t])/Norm[p3[t] - p1[t]]

R2[c_, t_] := c/(p3[t] - p1[t])*(p3[t] - p1[t])/Norm[p3[t] - p1[t]]

B2[a_, b_, c_, t_] := A2[a, b, t] - R2[c, t]

A3[a_, b_, t_] :=  a*(p3[t] - p2[t])*Exp[b*(p2[t] - p3[t])]*(p3[t] - p2[t])/Norm[p3[t] - p2[t]]

R3[c_, t_] := c/(p3[t] - p2[t])*(p3[t] - p2[t])/Norm[p3[t] - p2[t]]

B3[a_, b_, c_, t_] := A3[a, b, t] - R3[c, t]

sls = ParametricNDSolveValue[{p1'[t] == B1[a, b, c, t] + B2[a, b, c, t], p2'[t] == B3[a, b, c, t] - B1[a, b, c, t], p3'[t] == -B2[a, b, c, t] - B3[a, b, c, t], p1[0] == {-1, -1}, p2[0] == {0, 0}, p3[0] == {1, 1}}, {p1, p2, p3}, {t, 0, 100}, {a, b, c}]

However, no functions were specified for output from NDSolveValue. How do I make a plot of the $p_i(t)$ where the coordinates $x_i(t)$ are plotted against the coordinates $y_i(t)$? Any helps are appreciated.

$\endgroup$

2 Answers 2

1
$\begingroup$

The simplest way to fix your code is to remove

p1[t_] := {x1[t], y1[t]};

p2[t_] := {x2[t], y2[t]};

p3[t_] := {x3[t], y3[t]};

from your code (don't forget to Clear[p1,p2,p3]). Next you just need e.g.:

ParametricPlot[sls[1, 1, 1][[1]][t], {t, 0, 100}]

To plot them all in once you can

ParametricPlot[sls[1, 1, 1][t] // Through // Evaluate, {t, 0, 100}, PlotRange -> All]
$\endgroup$
1
$\begingroup$

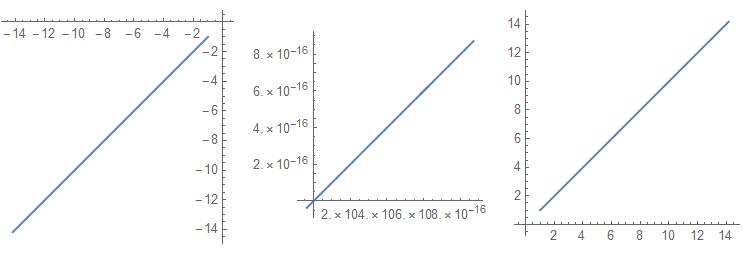
For example for parameter values $a=b=c=1$:

sls1 = sls[1, 1, 1];

GraphicsRow[ Table[ParametricPlot[(sls1 /. t -> s)[[i]], {s, 0, 100}], {i, 1, 3}]]

enter image description here

You can also visualize the parameter range with

Manipulate[ GraphicsRow[ Table[ParametricPlot[(sls[a, b, c] /. t -> s)[[i]], {s, 0, 100}], {i, 1, 3}]], {a, 0, 10}, {b, 0, 10}, {c, 0, 10}]

$\endgroup$
7
  • $\begingroup$ Unfortuntely, Mathematica gives me interpolating functions if I replace {p1,p2,p3} with {x1,y1,x2,y2,z3,y3}. Did you manage to run it without errors? $\endgroup$
    – E4M2227601
    Commented Apr 26, 2018 at 20:40
  • $\begingroup$ Do you get errors if you run the Manipulate command above? $\endgroup$
    – ulvi
    Commented Apr 26, 2018 at 21:00
  • $\begingroup$ Yes, I even get an error for running the sls command. $\endgroup$
    – E4M2227601
    Commented Apr 26, 2018 at 21:20
  • $\begingroup$ In defining sls make sure you use {p1[t], p2[t], p3[t]} as the solution targets as opposed to just {p1, p2, p3}. $\endgroup$
    – ulvi
    Commented Apr 27, 2018 at 1:46
  • $\begingroup$ You can get them even in one picture by using Manipulate[ ParametricPlot[Evaluate[sls[a, b, c]], {t, 0, T}, PlotRange -> {{-10, 10}, {-10, 10}}, ImageSize -> Large, AspectRatio -> 1], {{T, 1}, 0, 100}, {{a, 1}, 0, 10}, {{b, 1}, 0, 10}, {{c, 1}, 0, 10}]. Thanks for your and ulvi's efforts. Btw, how do you type in commands when replying someone? $\endgroup$
    – E4M2227601
    Commented Apr 27, 2018 at 10:38

Your Answer

By clicking “Post Your Answer”, you agree to our terms of service and acknowledge you have read our privacy policy.

Not the answer you're looking for? Browse other questions tagged or ask your own question.