I am using LinearModelFit to estimate four alternative model specifications on a small sample of 12 observations.
The models I'm using are
- ordinary linear model: $y=c+d_1D_1+d_2D_2+bx+k(x D_2)$
- log-linear model: $log(y)=c+d_1D_1+d_2D_2+bx+k(x D_2)$
- lin-log model: $y=c+d_1D_1+d_2D_2+blog(x)+k(log(x) D_2)$
and
- log-log model: $log(y)=c+d_1D_1+d_2D_2+blog(x)+k(log(x) D_2)$
The $D_j$'s are indicator variables and $y$ has its first two entries equal to zero, which poses a problem in the estimation of model specifications 2 and 4 ($log(0)\rightarrow-\infty$); to proceed with the estimation procedure, I simply replace the leading zeroes with $-1000$, when appropriate.
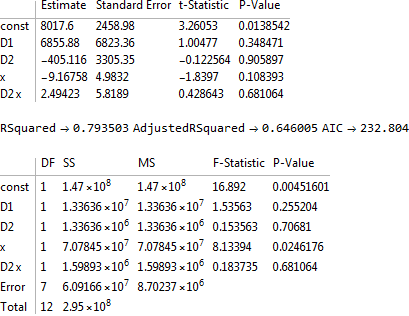
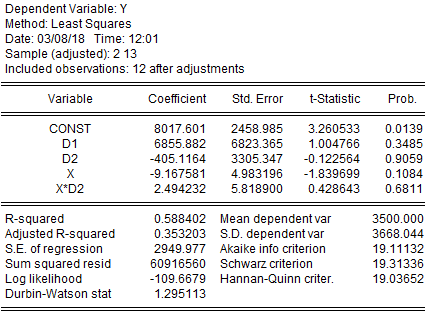
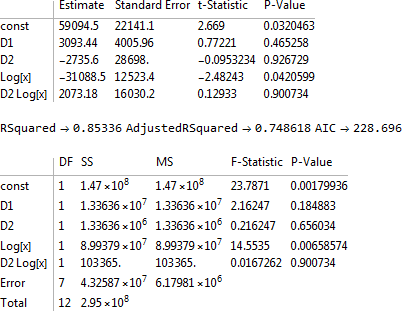
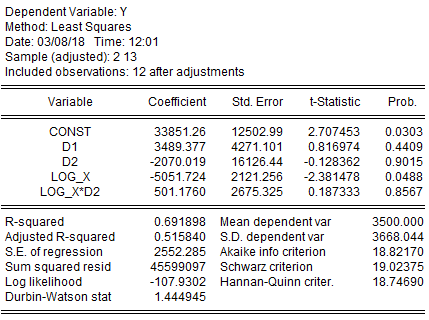
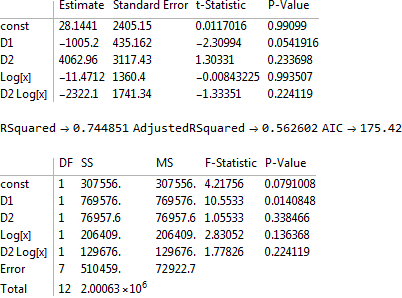
After comparing the output from LinearModelFit to that of another software, I realized that the estimated models 1 and 2 produced the same results (estimated parameters, standard errors, p-values) and differed in the values of $R^2$, adjusted $R^2$ and $AIC$ (Akaike info crit).
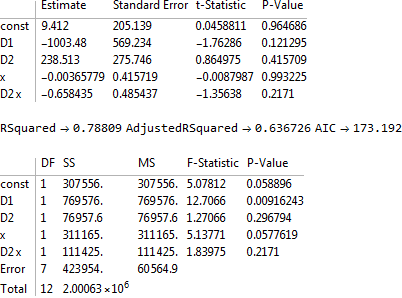
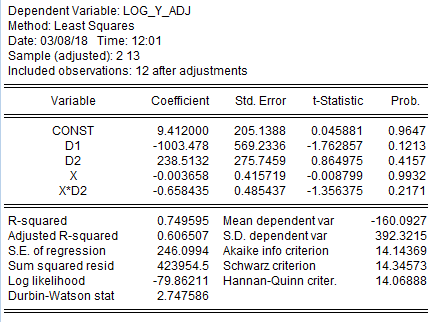
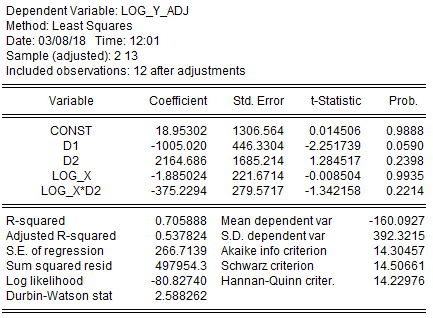
On the other hand, the output for models 3 and 4 were completely different between the two software.
Of all the observed discrepancies, I know that the values of $AIC$ can be attributed to different scaling used on different platforms; what seems troubling is the discrepancies observed in the rest reported values.
I reproduce the output from LinearModelFit along with the data used in the end notes; also, I include a sample script and accompanying data and output from the other software I used.
I am confused and I would like some help troubleshooting this problem. Up until now, I had no reason to consider either software as more 'reliable', so I don't know where to start.
Please note, I have also tested slightly different specifications of LinearModelFit (eg, switched IncludeConstantBasis on/off with the appropriately required change in input data) and done analogous changes in the other software; the results did not change; the discrepancies persisted.
End notes
(* function used to extract information from LinearModelFit output *)
info=Grid[{#[{"ParameterTable"}], {"RSquared", "AdjustedRSquared", "AIC"} -> #[{"RSquared", "AdjustedRSquared", "AIC"}] // Thread // Riffle[#, Null] & // Row // List, #[{"ANOVATable"}]} // Riffle[#, {{Null}}] &, Alignment -> Left]&
model 1
table=Uncompress["1:eJxTTMoPSuNlYGAoZgESPpnFJWmsyLxiEC85Pw/IYgKyXAwhlFExI5CqAJOVqDoyQWIQAogZimbNBILImQ5gHjalDDD1RevcH1aJNEwmRqkISC3LRIfML4yElO6Qa30dmFDnkHmHlZBSYxBYXOaQuYObkFKgmTvkcvMcMgvECSmN6T/0VeNMgUOmgDoepQzwEHjXQ8BbYKVBIH9drCTgLYSpdsUEvMUA99bdTALeAitNA4G+HIi3ANOjdlY="];
data=Rest[table];
xs={const, D1, D2, x};
fs={const, D1, D2, x, D2 x};
lmf=LinearModelFit[data, fs, xs, IncludeConstantBasis -> False];
info[lmf]
Eviews output
model 2
table=Uncompress["1:eJxTTMoPSuNlYGAoZgESPpnFJWmsyLxiEC85Pw/IYgKyXAwhlFExI5CqAJOVqDqKGMDggz06g4GhaNZMIIic6RBkD+TpGhoYGOgZ4AGGxkDC2MLS3DjB0FTP0tTEFMg2NzC0BOo0w28r0DK4yDr3h1UiDZPpbKsIyFqWiQ5FSTs2WB66LeFAvNYdcq2vAxPqHIpUf0bf2OMgS4JWYxBYXOZQZLhAdo4TswIJWoF27pDLzXMouuDMe0YtTZEErTH9h75qnClwKBIL3bp7Y7YSsVqBDHDkvOshOZiAjCBQOF2sJDmYYLbaFZMcTEAGOJjuZpIcTEBGGgj05SCCCQAessDY"];
data=Rest[table];
xs={const, D1, D2, x};
fs={const, D1, D2, x, D2 x};
lmf=LinearModelFit[data, fs, xs, IncludeConstantBasis -> False];
info[lmf]
Eviews output
model 3
table=Uncompress["1:eJxTTMoPSuNlYGAoZgESPpnFJWmsyLxiEC85Pw/IYgKyXAwhlFExI5CqAJOVqDqKGMDggz06g4GhaF9b3Gn+ibIOcBH8WoE64CK/F4gcz2qRIUfrtK/h17/+kIZqdah3IF5rQf11px37JKBaC6aToDXFZuGP2RPFYVqXk6B15sQHbPN/icK0bidB68PdnhxCCWJQrR2HidUKZLhP6djXE0R6MAEZm+0KzvpJkB5MQMbx74vkLV+LkRxMQEbQXiUbpxDSgwlkq/50p9U7RRHBBACX3ZNg"];
data=Rest[table];
xs={const, D1, D2, x};
fs={const, D1, D2, Log[x], D2 Log[x]};
lmf=LinearModelFit[data, fs, xs, IncludeConstantBasis -> False];
info[lmf]
Eviews output
model 4
table=Uncompress["1:eJxTTMoPSuNlYGAoZgESPpnFJWmsyLxiEC85Pw/IYgKyXAwhlFExI5CqAJOVqDqKGMDggz06g4GhaF9b3Gn+ibIOQfZAnq6hgYGBngEeYGgMJIwtLM2NEwxN9SxNTUyBbHMDQ0ugTjP8tgItg4v8XiByPKtFhs62Tvsafv3rD2mHoqQdGywP3ZZwIF5rQf11px37JByKVH9G39jjIEuC1hSbhT9mTxR3KDJcIDvHiVmBBK0zJz5gm/9L1KHogjPvGbU0RRK0PtztySGUIOZQJBa6dffGbCVitQIZ7lM69vUEkR5MQMZmu4KzfhKkBxOQcfz7InnL12IkBxOQEbRXycYphPRgAtmqP91p9U5RRDABAAErv1g="];
data=Rest[table];
xs={const, D1, D2, x};
fs={const, D1, D2, Log[x], D2 Log[x]};
lmf=LinearModelFit[data, fs, xs, IncludeConstantBasis -> False];
info[lmf]
Eviews output
This is a link to a zip file containing files 'eviews_data.csv' and 'replicate.prg'. Extract both files at a directory of your choosing; to run 'replicate.prg' please edit the first command by inserting the full path to file 'eviews_data.csv'.

Logis taken not once but twice for the variable labeledx. That is why the differences occur among the results from different packages. That issue would have been more readily evident if the short dataset was not shown in just compressed form. $\endgroup$