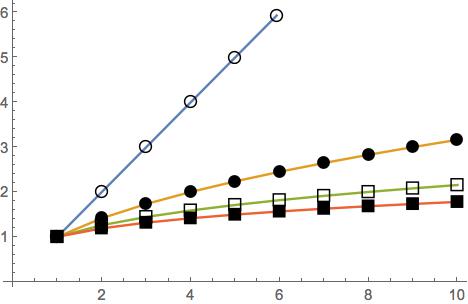
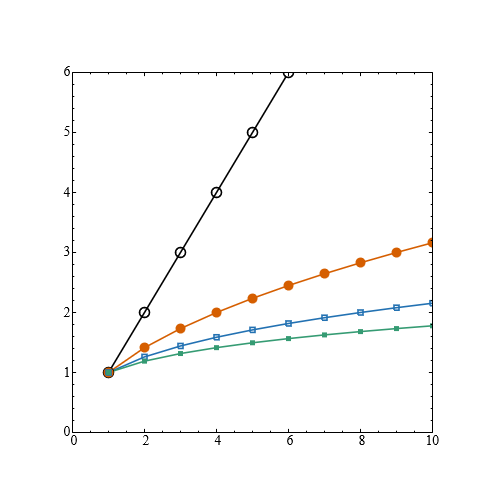
I am working in Mathematica 11.0.1.0 for Mac. This is taken directly from the Mathematica documentation for ListLinePlot
{m1, m2, m3, m4} = Graphics /@ {Circle[{0, 0}, 1], Disk[{0, 0}, 1], Line[{{-0.5, -0.5}, {0.5, -0.5}, {0.5, 0.5}, {-0.5, 0.5}, {-0.5, -0.5}}], Polygon[{{-0.5, -0.5}, {0.5, -0.5}, {0.5, 0.5}, {-0.5, 0.5}}]}

ListLinePlot[Table[n^(1/p), {p, 4}, {n, 10}], PlotMarkers -> Table[{s, 0.05}, {s, {m1, m2, m3, m4}}]]
and makes the plot:
Next I tried to put the plot in a "Figure Panel" in SciDraw:
Figure[
 FigurePanel[{
   FigGraphics[
    ListLinePlot[Table[n^(1/p), {p, 4}, {n, 10}],
     PlotMarkers ->
      Table[{s, 0.05}, {s, {m1, m2, m3, m4}}]]]},
  XPlotRange -> {0, 10}, XFrameLabel -> "x", YPlotRange -> {1, 6}],
 CanvasSize -> {5, 5}]
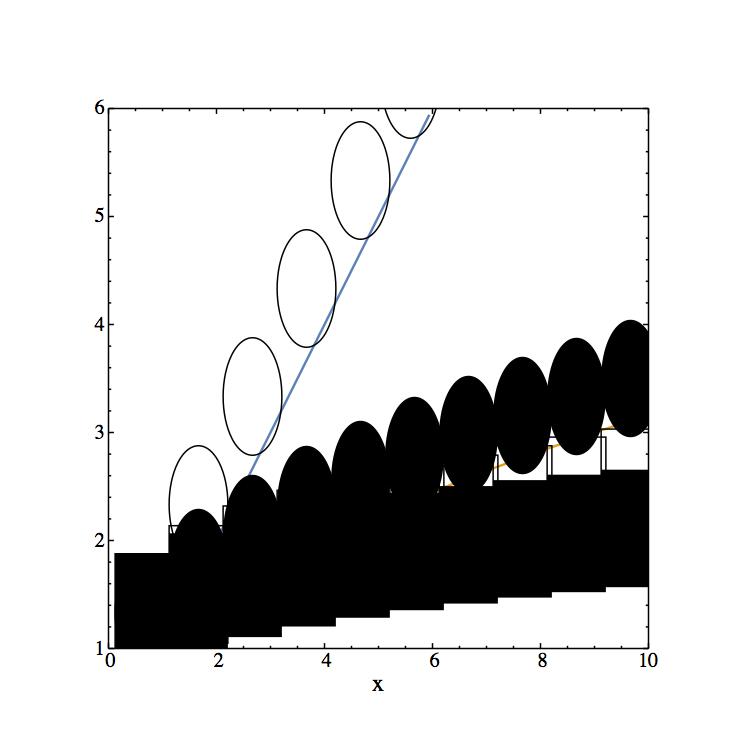
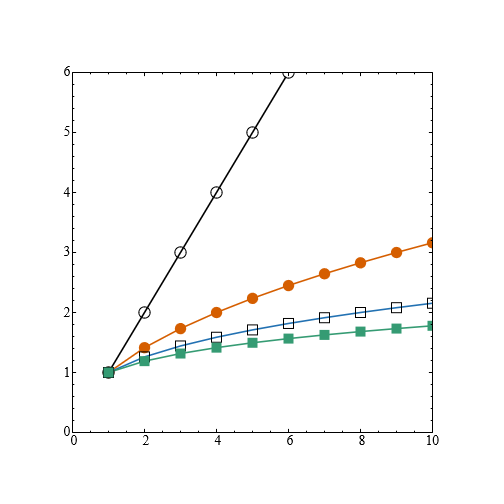
It made an all black figure (not shown). Changing s from 0.05 to 0.005, gives:
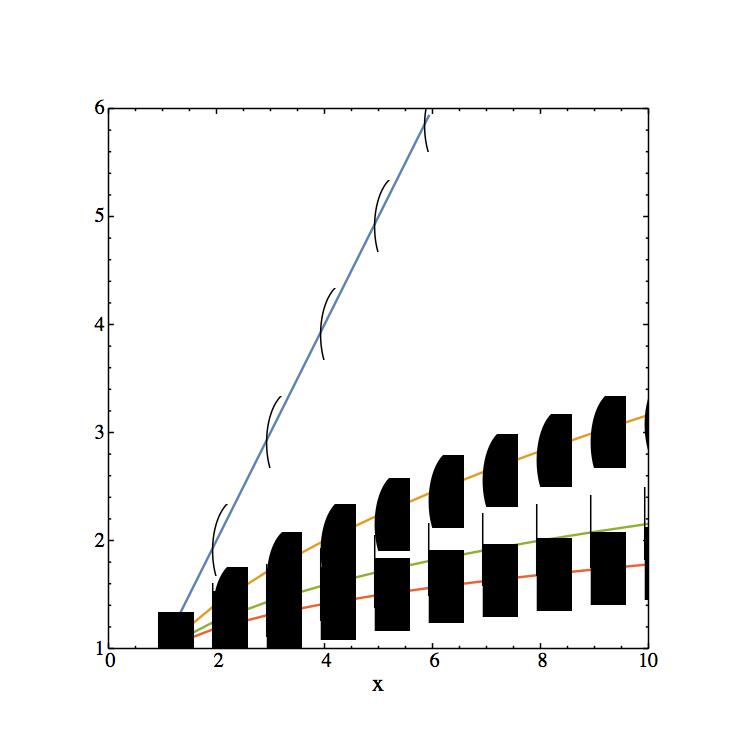
Trying to shrink s further yields:
Clearly, PlotMarkers does not scale properly in SciDraw. My questions are
- Why not?
- How can I get the proper figure to appear in a SciDraw Figure Panel?
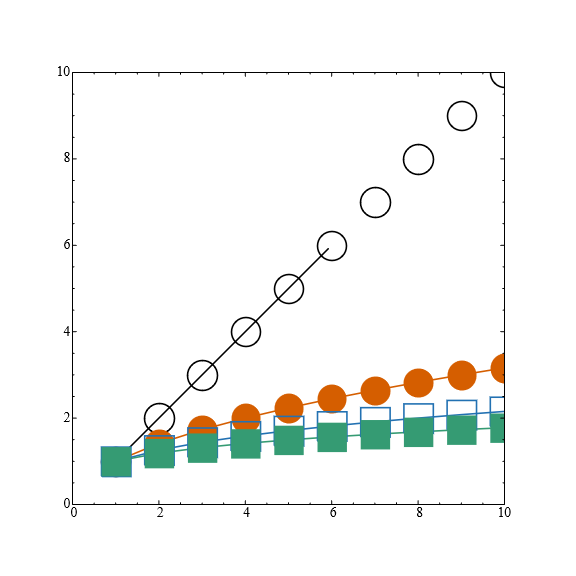
Ultimately the goal is to have a multipanel figure made in SciDraw with my own data and custom (properly scaled!) plot markers.

