1
$\begingroup$

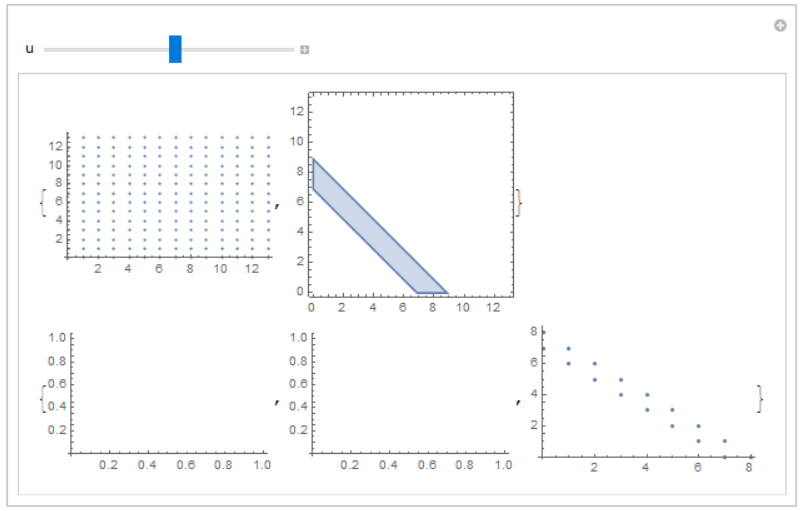
I tried to plot integer points that fall into a 2D region that's dynamically changed. So I resort to Cases and Select, but Cases with Condition is not working expectedly. Here is the simplifed version of my code and result:

region[u_] := u <= x + y <= u + 2;
intPoints = Flatten[Table[{x, y}, {x, 0, 13}, {y, 0, 13}], 1];
Manipulate[
 Column[{
   {ListPlot[intPoints], 
    RegionPlot[region[u], {x, 0, 13}, {y, 0, 13}]},
   {ListPlot[Cases[intPoints, {x_, y_} /; region[u]]],
    ListPlot[Cases[intPoints, {x_, y_} /; Evaluate[region[u]]]],
    ListPlot[Select[intPoints, region[u] /. {x -> #[[1]], y -> #[[2]]} &]]}}],
 {u, 0, 13}
 ]

enter image description here

I don't understand why inside Cases the point coordinates x and y won't go into region for the Condition to be evaluated. Does it first do the replacement of x and y and then do the evaluation? But why the additional Evaluate operation still doesn't help?

Could someone elaborate me on this? Thanks.

$\endgroup$

1 Answer 1

0
$\begingroup$

Cases could not 'see' x and y from the pattern {x_,y_} (Condition has Attribute HoldAll); it could have been resolved using Evaluate around region[u].

In short, use Initialization; allows for better control over the content of Manipulate.

Manipulate[
 (* expr *)
 grid[u],

 (* control *)
 {u, 0, 13},

 (* init *)
 Initialization :> (
   (* points *)
   intPoints = Flatten[Table[{x, y}, {x, 0, 13}, {y, 0, 13}], 1];

   (* redefined region function; making point coordinates explicit *)
   region[u_, x_, y_] := u <= x + y <= u + 2;

   (* list plot *)
   listPlot = ListPlot[intPoints];

   (* region plot *)
   regionPlot[u_] := RegionPlot[region[u, x, y], {x, 0, 13}, {y, 0, 13}, PlotLabel -> RegionPlot];

   (* list plot - Cases *)
   listPlotCases[u_] := ListPlot[Cases[intPoints, {x_, y_} /; region[u, x, y]], PlotLabel -> Cases, PlotRange -> {{0, 13}, {0, 13}}];

   (* list plot - Select *)
   listPlotSelect[u_] := ListPlot[Select[intPoints, region[u, #[[1]], #[[-1]]] &], PlotLabel -> Select, PlotRange -> {{0, 13}, {0, 13}}];

   (* assemble output *)
   grid[u_] := Grid[{
      {listPlot, regionPlot[u]},
      {listPlotCases[u], listPlotSelect[u]},
      {Style[StringTemplate["u=``"][u], Red, Bold, Large], SpanFromLeft}
      }];
   ),
 SynchronousInitialization -> False,
 SynchronousUpdating -> False,
 LocalizeVariables -> True
]

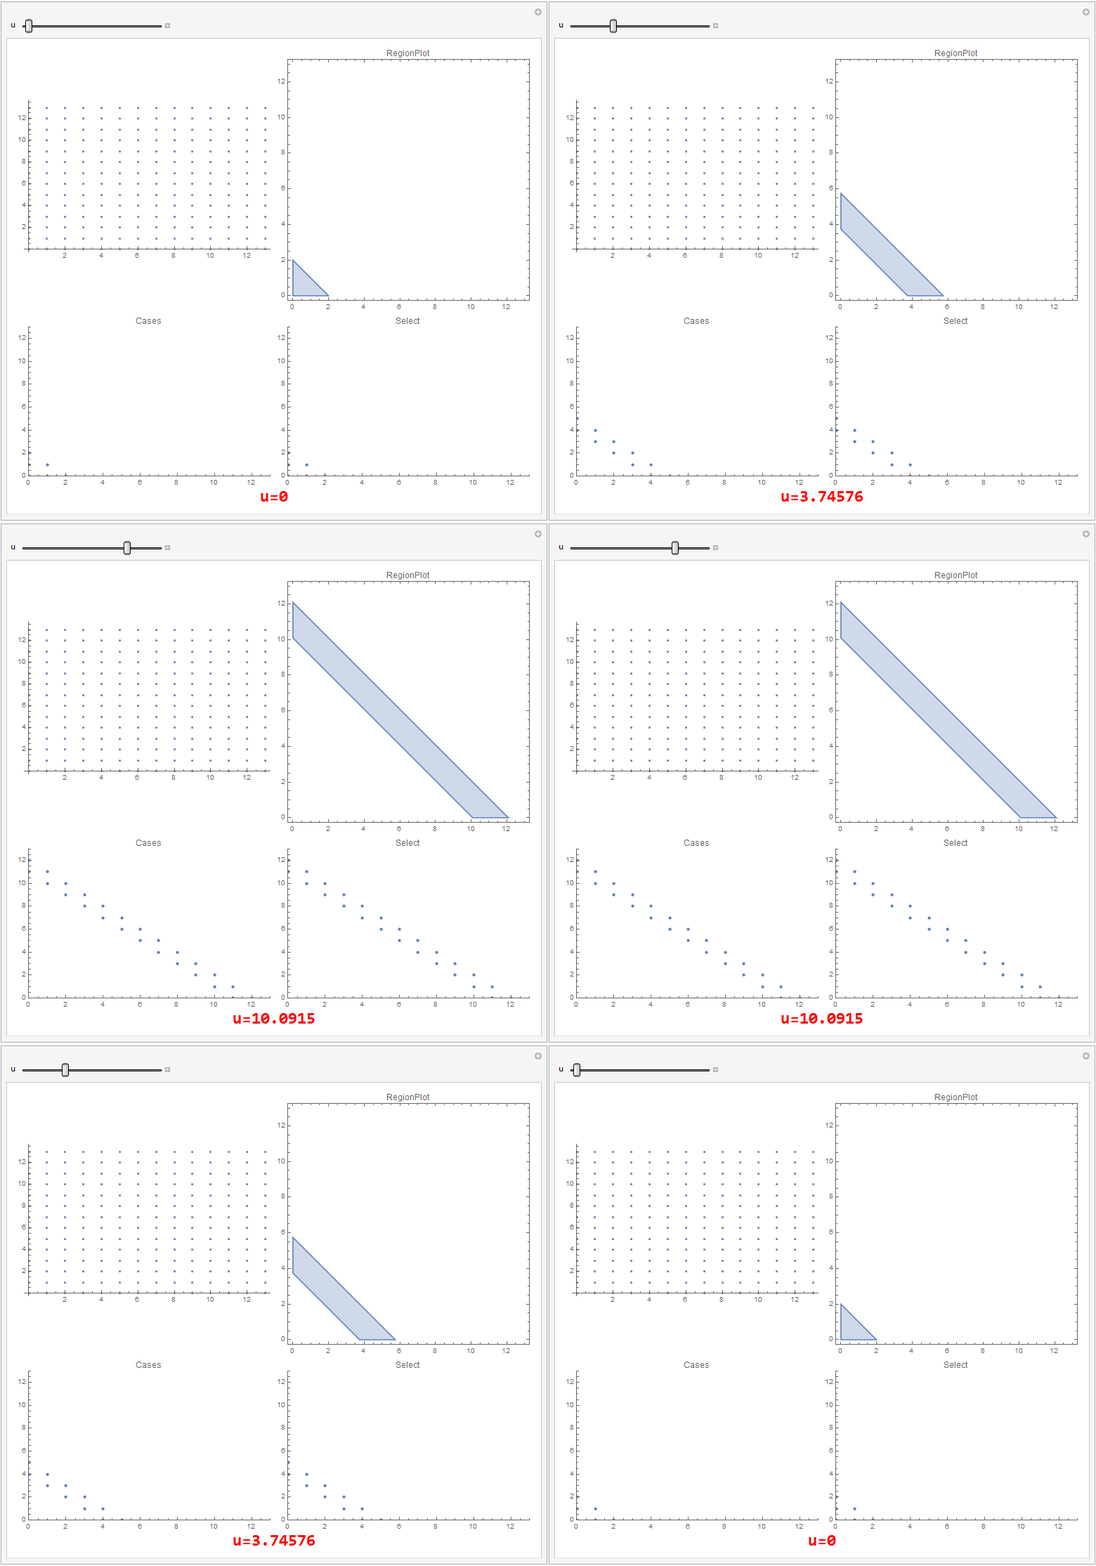
The code above outputs

enter image description here

$\endgroup$
2
  • $\begingroup$ Thanks for your solution. I learned some good practice from your code. I still need to understand why Evaluate[region[u]] won't work. And when I set LocalizeVariables -> False, this line ListPlot[Cases[intPoints, {x_, y_} /; Evaluate[region[u]]]] actually works inside Manipulate, just like it works inside Dynamic. Could you help me explain why this is the case? Thanks. $\endgroup$ Commented Feb 28, 2018 at 14:01
  • $\begingroup$ you're welcome! it's nice to know the answer was helpful; I think it would be instructive to evaluate Manipulate[aHead[{x_, y_} /; region[u]] // FullForm, {u, 0, 13}, LocalizeVariables -> False] with LocalizeVariables set to False/True (defaults to True) and with using/not using Evaluate; notice what happens to the variables $\endgroup$
    – user42582
    Commented Feb 28, 2018 at 15:25

Your Answer

By clicking “Post Your Answer”, you agree to our terms of service and acknowledge you have read our privacy policy.

Not the answer you're looking for? Browse other questions tagged or ask your own question.