2
$\begingroup$

Consider the following code:

DateListPlot[{{1514820721, 3}, {1514969636, 5}, {1514969637, Mean[{}]},
              {1514969952, 5}, {1514993369, 4}}, DateFunction -> FromUnixTime]

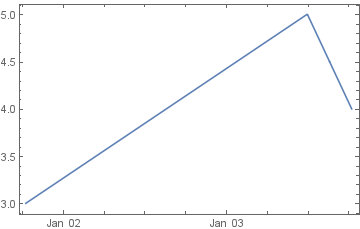
output 1

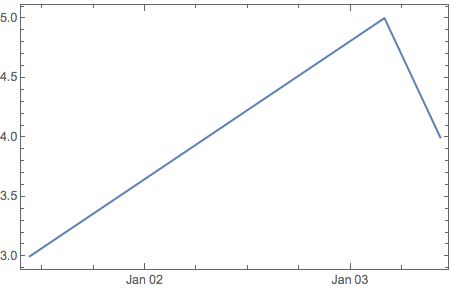
I spent quite some time looking why the dates appear shifted (the list here is a simplification of a much larger data set) only to find that if I remove the entry with non-numeric entry of Mean[{}], then the dates are as they should:

DateListPlot[{{1514820721, 3}, {1514969636, 5}, {1514969952, 5},
              {1514993369, 4}}, DateFunction -> FromUnixTime]

output 2

Now I wonder: what's happening here? Why does the presence of this non-numeric entry in the input list result in shifted dates on the X-axis?

$\endgroup$

1 Answer 1

2
$\begingroup$

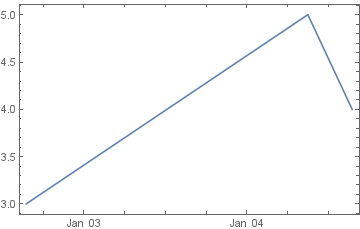
Looks like a bug to me, because you would get the correct labeling if you were to make the time conversion on the data before you passed it into DateListPlot

data = 
  {{1514820721, 3}, {1514969636, 5}, {1514969637, Mean[{}]}, 
   {1514969952, 5}, {1514993369, 4}};
data1 = MapThread[{FromUnixTime[#1], #2} &, Transpose @ data]
DateListPlot[data1]

plot

Update

I reported this to Wolfram tech support and received the following reply (edited to omit boilerplate and other non-relevant material).

I was able to reproduce the issue, and consequently, I filed a report with our development team raising the issue ....

Therefore, I am tagging the guestion with

$\endgroup$

Your Answer

By clicking “Post Your Answer”, you agree to our terms of service and acknowledge you have read our privacy policy.

Not the answer you're looking for? Browse other questions tagged or ask your own question.