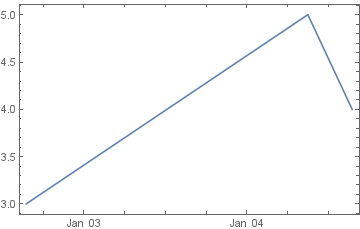
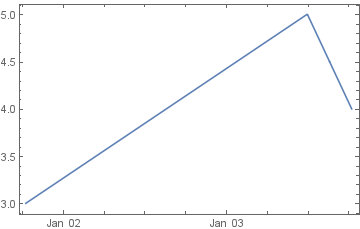
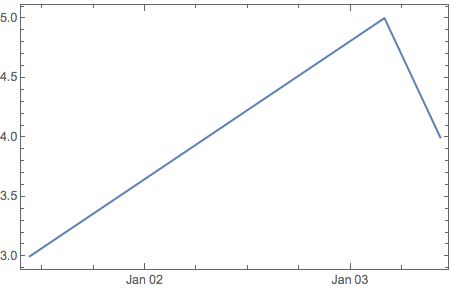
Consider the following code:
DateListPlot[{{1514820721, 3}, {1514969636, 5}, {1514969637, Mean[{}]},
              {1514969952, 5}, {1514993369, 4}}, DateFunction -> FromUnixTime]
I spent quite some time looking why the dates appear shifted (the list here is a simplification of a much larger data set) only to find that if I remove the entry with non-numeric entry of Mean[{}], then the dates are as they should:
DateListPlot[{{1514820721, 3}, {1514969636, 5}, {1514969952, 5},
              {1514993369, 4}}, DateFunction -> FromUnixTime]
Now I wonder: what's happening here? Why does the presence of this non-numeric entry in the input list result in shifted dates on the X-axis?


