I have this code:
p = ListPlot[Table[Table[{x, m x}, {x, 0, 20000, 100}],
                   {m, 0.05/20000, 7/20000, (7 - 0.05)/20000/20}],
             PlotLabels -> {"a", "asdfdfasfasdfasd", a, a, a, a, a, a, a, a,
                            "adfsfasda", "aasdfadfsfasdafsdfasd"},
             PlotRange -> {Full, {0, 2}}, ImageSize -> 500]
rp = Rasterize[p]
Export["/tmp/foo2-p.pdf", p]
Export["/tmp/foo2-rp.pdf", rp]
Export["/tmp/foo2-p.png", p]
Export["/tmp/foo2-rp.png", rp]
I get the following images:
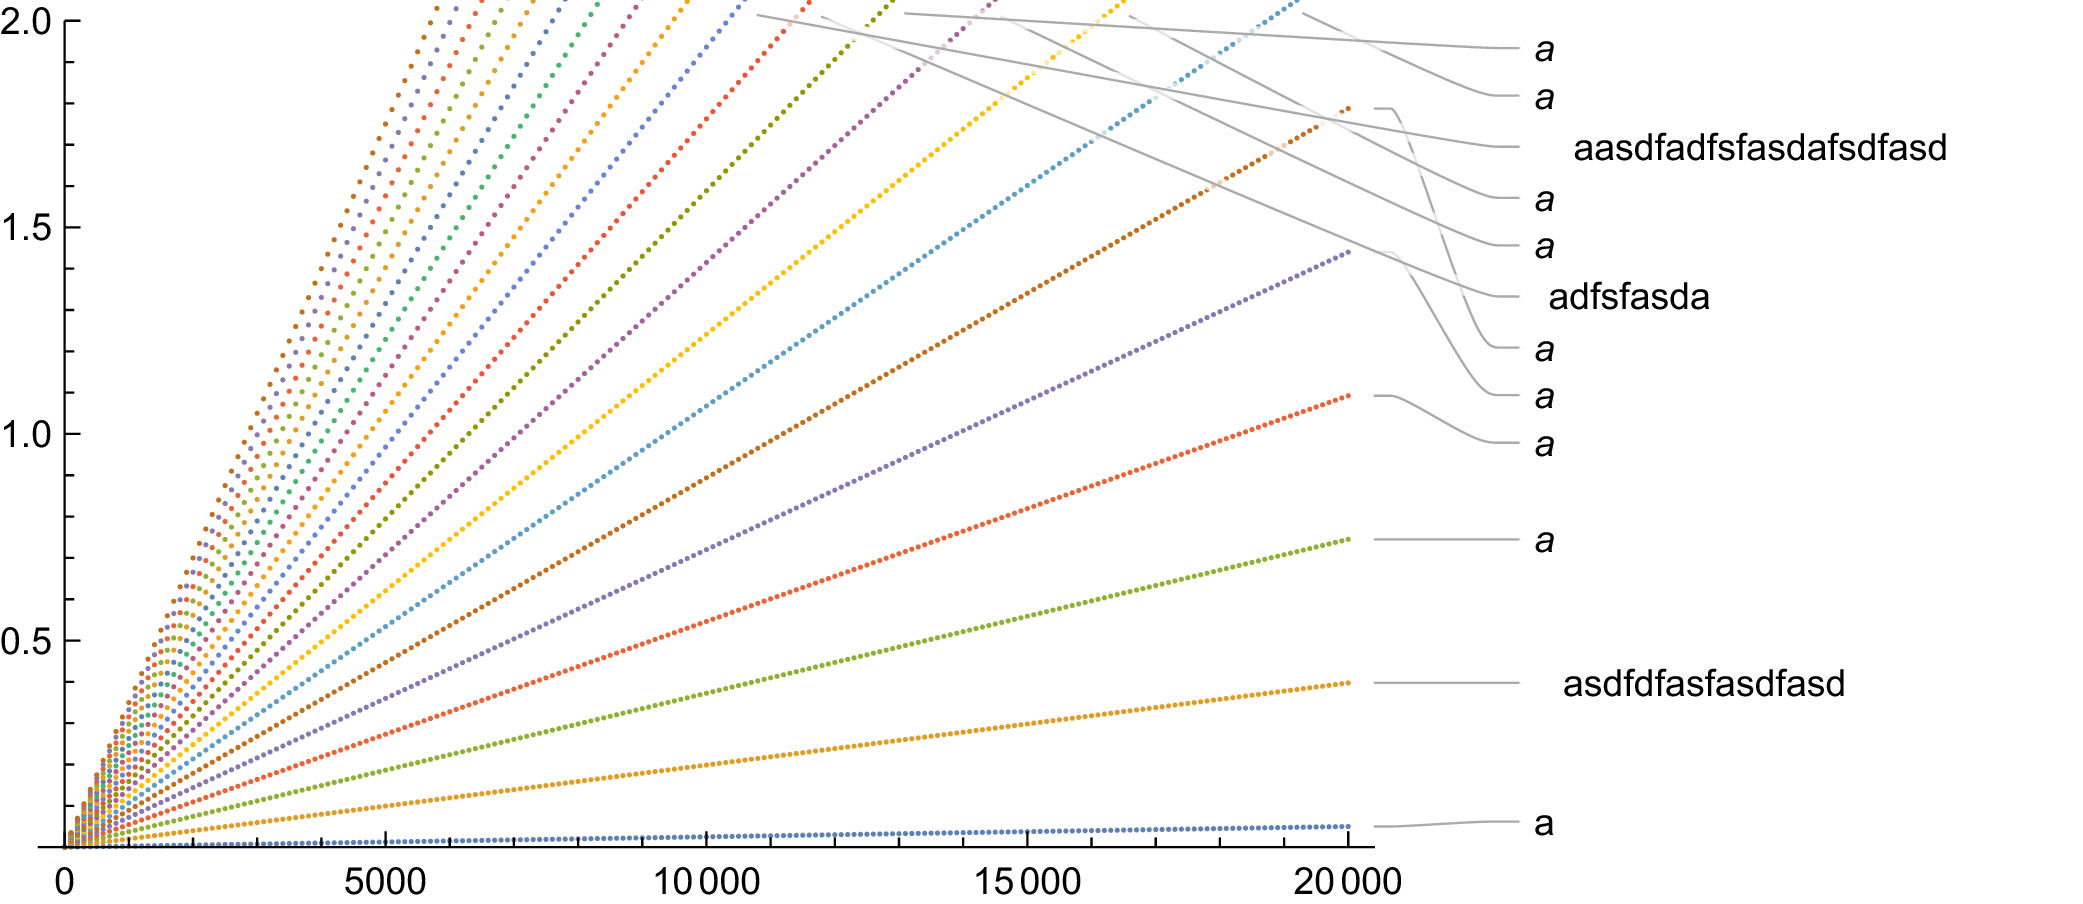
foo2-p.pdf:
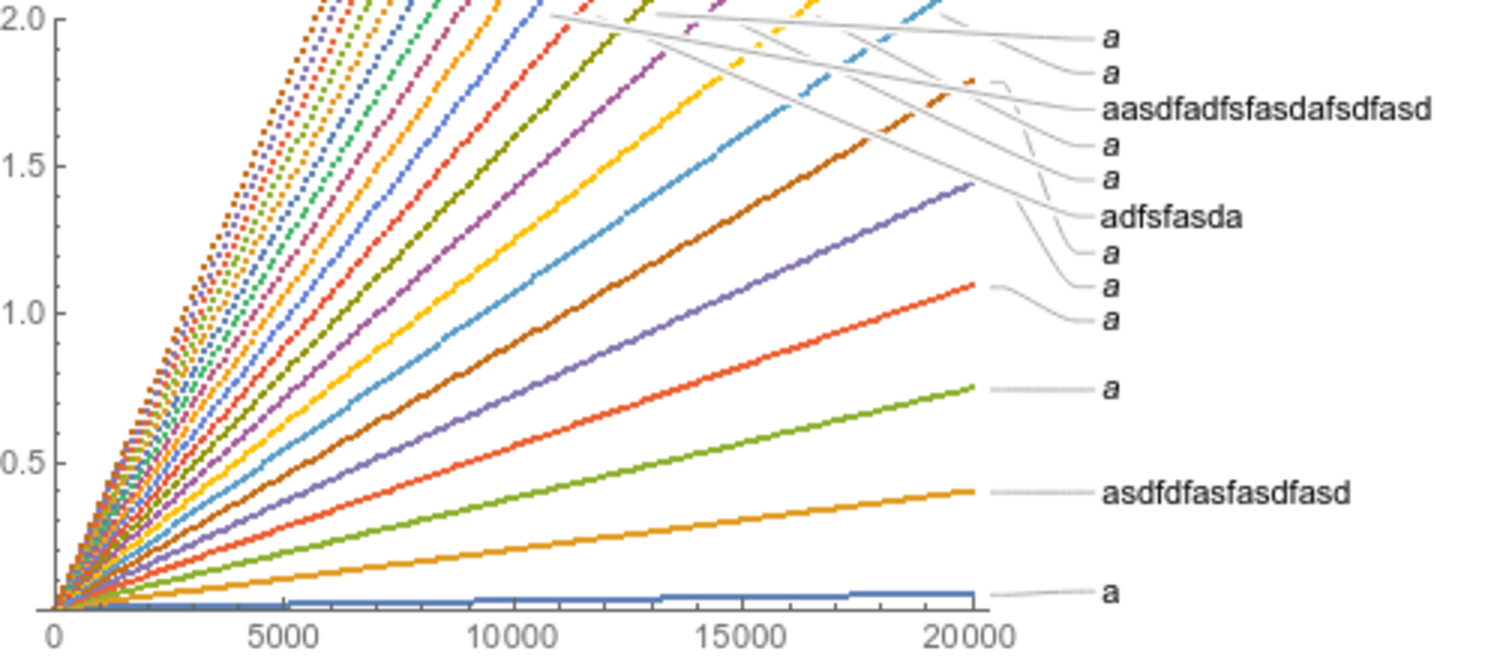
foo2-rp.pdf:
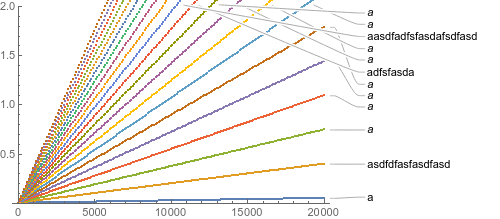
foo2-p.png:
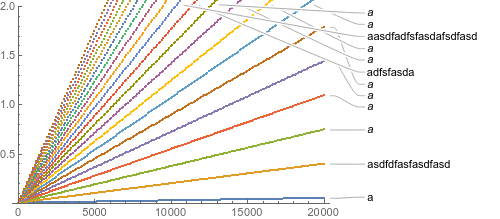
foo2-rp.png:
If I rasterize first, or if I export to png, then the long names are horizontally aligned with the other names. However, if I export directly to pdf, then the names are horribly misaligned. How do I fix this issue without rasterizing the labels? And why is Mathematica doing this? (If it's relevant, I'm using Mathematica 11.2.0.0 on Linux x86_64.)
I've noticed that, using ImageMagick to convert the pdfs to pngs to upload them, the plot labels seem to be centered in boxes that are correctly aligned. So I suspect that one way of fixing this could be somehow tricking Mathematica into thinking that the shorter text is longer than it (a la LaTeX's \smash, \rlap, \llap, \phantom, etc).


