4
$\begingroup$

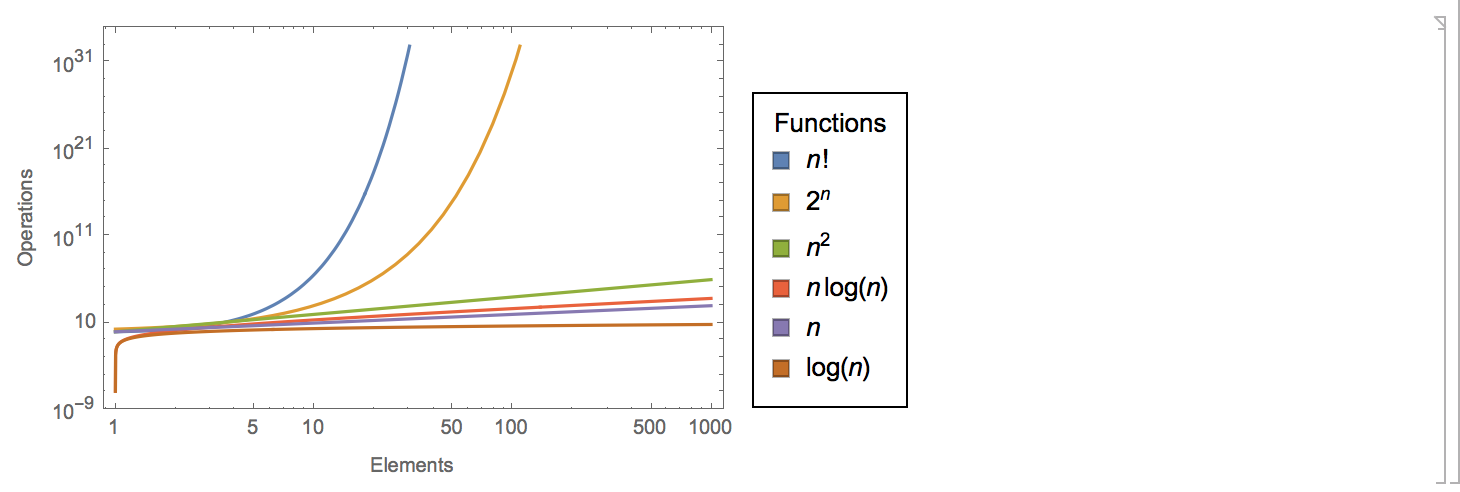
I made this plot

LogLogPlot[{n!, 2^n, n^2, n Log[n], n, Log[n]}, {n, 1, 1000}, 
  Frame -> True, FrameLabel -> {"Elements", "Operations"}, 
  PlotLegends -> SwatchLegend["Expressions", LegendLabel -> "Functions", 
  LegendFunction -> (Framed[#, Background -> None] &)], 
  Background -> None]

enter image description here

Now I want to replace the legend with callouts labeling the traces, but I'm having some trouble:

funs = Callout[#, ToString@#, Above] & /@ {n!, 2^n, n^2, n Log[n], n, Log[n]};
LogLogPlot[Evaluate@funs, {n, E, 1000}, 
Frame -> True, 
AxesLabel -> {"Elements", "Operations"}, 
Background -> None, 
PlotRange -> {{E, 1000}}]

enter image description here

I'd like the callouts to be placed next to the function it calls out, not on top. Seems like none of the argument values for positioning the callout (Before, After, Above, Below) get this right.

$\endgroup$
2
  • $\begingroup$ Your code as posted (the second one) gives an error Plot::invpr: Value of option PlotRange is not compatible with the option ScalingFunctions -> {{Log,Exp},{Log,Exp}} $\endgroup$
    – Nasser
    Commented Dec 11, 2017 at 4:24
  • $\begingroup$ @Nasser fixed it, thanks $\endgroup$
    – M.R.
    Commented Dec 11, 2017 at 4:54

2 Answers 2

3
$\begingroup$

I assume by "having trouble" you mean the formating part. In this case, this produces better result. Using TraditionalForm in place of ToString

 funs=Callout[#,TraditionalForm@#,Above]&/@{n!,2^n,n^2,n Log[n],n,Log[n]};

Now

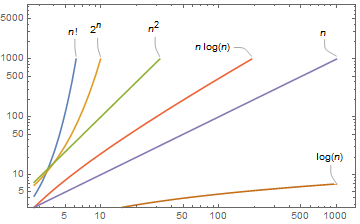
Mathematica graphics

Also these work

funs=Callout[#,#,Above]&/@{n!,2^n,n^2,n Log[n],n,Log[n]};
funs=Callout[#,Text@#,Above]&/@{n!,2^n,n^2,n Log[n],n,Log[n]};

Just do not use ToString

$\endgroup$
5
$\begingroup$

Positioning callouts can be tricky, but there is a lot more positioning control available than the predefined values Before, After, Above, and Below. It is possible to explicitly and separately set the both label point and the anchor point. I will show you how to do that.

First, let's get separate definitions for the functions and their labels.

funcs = {n!, 2^n, n^2, n Log[n], n, Log[n]};
lbls = HoldForm /@ funcs;

Now let's make a preview plot so we can extract the end points of the function traces.

preview = 
  LogLogPlot[Evaluate@funcs, {n, E, 1000}, PlotRange -> {{E, 1000}, {1, 1000}}];
endPts = Exp[Last @@@ Cases[preview, Line[__], ∞]];

Now let's build the callouts. I am not certain what you mean by "callouts to be placed next to the function it calls[out]", but because of the way your functions fill the plot viewport, I have chosen to place the anchor points at the end of the traces and the function labels to the right of and a little below the end of the traces. I hope this interpretation is close to what you have in mind.

traces = 
  MapThread[
    Callout[#1, #2, #3 + {.125 #3[[1]], -.01 #3[[2]]}, #3] &, 
    {funcs, lbls, endPts}];

Note that the 3rd argument to Callout sets the position of label and the 4th argument sets the position of the anchor point.

LogLogPlot[Evaluate@traces, {n, E, 1000},
  PlotRange -> {Automatic, {1, 1000}},
  PlotRangePadding -> {{Automatic, Scaled[.075]}, {Automatic, Scaled[.05]}},
  Frame -> True,
  FrameLabel -> {"Elements", "Operations"},
  ImageSize -> 600]

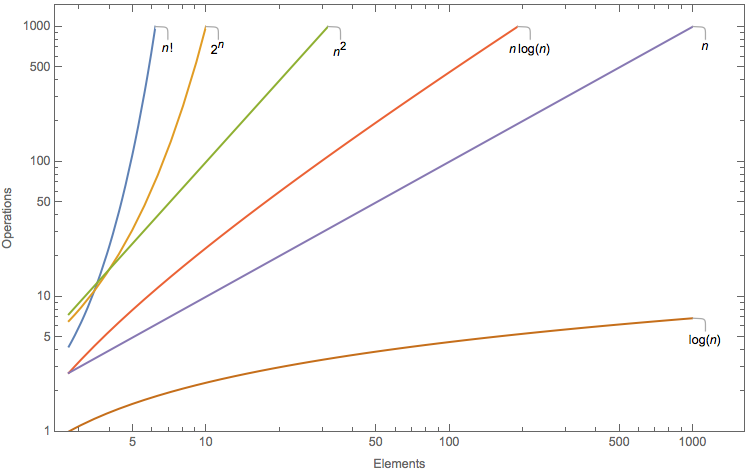
plot

$\endgroup$

Your Answer

By clicking “Post Your Answer”, you agree to our terms of service and acknowledge you have read our privacy policy.

Not the answer you're looking for? Browse other questions tagged or ask your own question.