2
$\begingroup$

Here is a simple demo code, with which I thought I could rotate a 3D point set around the different axes:

SeedRandom[1];
data = RandomReal[10, {20000, 3}];

Manipulate[

 e = EulerMatrix[{alpha Degree, beta Degree, gamma Degree}];
 datanew = e.# & /@ data;

 Graphics3D[{PointSize[Small], Point[datanew, 
  VertexColors -> (Hue /@ Rescale[datanew[[All, 1]]])]}, 
  ViewProjection -> "Orthographic"],

 {alpha, 1, 180, 1}, {beta, 1, 180, 1}, {gamma, 1, 180, 1}

 ]

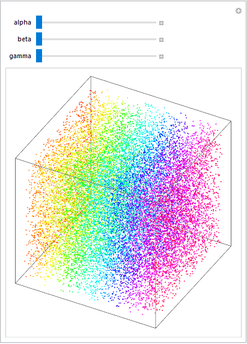
When I start this I get the following inital view:

enter image description here

My questions/problems:

  1. When I use the sliders, why is the box not rotating together with the data?

  2. (This is most annoying) When I use the sliders the rotation is MUCH slower compared to the one when I touch the volume with mouse and rotate it. What is the difference of these two interactions?

  3. When I rotate the volume with the mouse the slider don't get the information about the changed angles.

  4. How can the size of the view window be held fixed during rotation, so that the whole box is seen?

$\endgroup$
2
  • $\begingroup$ Put your view point in the ViewPoint option to the plot as ViewPoint->Dynamic[...]. When you update any of the sliders you are wholly regenerating the render of your data, rather than just changing how the front-end displays it. Using the correct option will fix it. $\endgroup$
    – b3m2a1
    Commented Oct 30, 2017 at 16:11
  • 1
    $\begingroup$ Some answers: 1.- The box does not rotate because you are transforming the data coordinates in that "reference" box. Use ViewPointto rotate de view. 3. Just change to {alpha, 1, 180, 1, Appearance-> "Labeled}. 4. Use the option SphericalRegion, thus, the final image will be scaled so that a sphere drawn around the three-dimensional bounding box would fit in the display area specified. $\endgroup$ Commented Oct 30, 2017 at 19:27

2 Answers 2

4
$\begingroup$

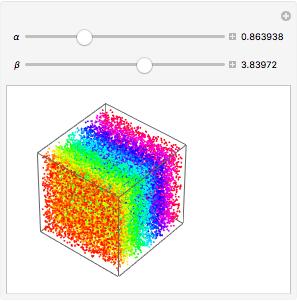
After my previous comments. I have tried with this (I have used the package Developer in order to pack the array, thus, making increasing the speed of the operations with the huge data):

<< Developer`; 
SeedRandom[1];
data = ToPackedArray[RandomReal[10, {20000, 3}]];

Manipulate[
  Graphics3D[
    { PointSize[Small], Point[data, VertexColors -> (Hue /@Rescale[data[[All,1]]])]
    }
  , SphericalRegion -> True, Axes -> False
  , ViewPoint ->N@Dynamic[15*{Sin[α] Cos[β], Sin[α] Sin[β],Cos[α]}]
  , ImageSize -> Small
  ]
, {{α, N@π/3}, 0., π, π/360, Appearance -> "Labeled"}
, {{β, N@π/4}, 0., 2 π, 2 π/360, Appearance -> "Labeled"}
]

enter image description here

EDIT

Taking into account the comment from Kuba, as I did not consider colouring, I post a new version based on the original. Basically, I have included a cube that contains the data and rotates with them:

<< Developer`;
SeedRandom[1];
data = ToPackedArray[RandomReal[10, {20000, 3}]];

Manipulate[
  e = EulerMatrix[{alpha Degree, beta Degree, gamma Degree}];
  datanew = ToPackedArray[e.# & /@ data];
  \[ScriptCapitalC] =GeometricTransformation[Cuboid[{0., 0., 0.}, {10., 10., 10.}], e];
    Graphics3D[
       {{Opacity[0.], \[ScriptCapitalC]},PointSize[Small],
        Point[datanew,VertexColors -> (Hue /@ Rescale[datanew[[All, 1]]])]}, 
       ViewProjection -> "Orthographic", ImageSize -> Medium, 
       Boxed -> False, ViewPoint -> {0.25, -.5, .25}
    ],
    {{alpha, 24}, 1.,180, 1., Appearance -> "Labeled"}, {{beta, 30}, 1., 180, 1., 
    Appearance -> "Labeled"}, {{gamma, 10}, 1., 180, 1.,Appearance -> "Labeled"}
  ]

It is still a bit sloppy in my iMac (number of points?), even packaging the data. Hopefully, someone will optimise this issue.

$\endgroup$
3
  • 2
    $\begingroup$ +1, ViewPoint ->N@Dynamic it the key feature here as data does not need to travel back and forth to produce another view. $\endgroup$
    – Kuba
    Commented Oct 30, 2017 at 20:00
  • $\begingroup$ @José Antonio Díaz Navas: Thank you very much for you help. What could be the reason that your edited code is relatively slow compared to your solution shown above where you don't use EulerMatrix? $\endgroup$
    – mrz
    Commented Nov 3, 2017 at 16:24
  • 1
    $\begingroup$ @mrz as noted by Kuba rotating the data also rotates the color, and the original problem hue does not rotate with data, just only these. However, if you want to rotate hue with data, go back to my first approach ;)) $\endgroup$ Commented Nov 3, 2017 at 16:28
7
$\begingroup$

This answers the slowness part.

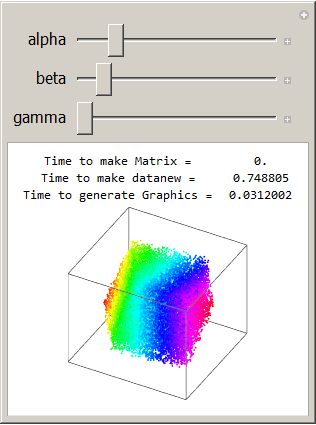
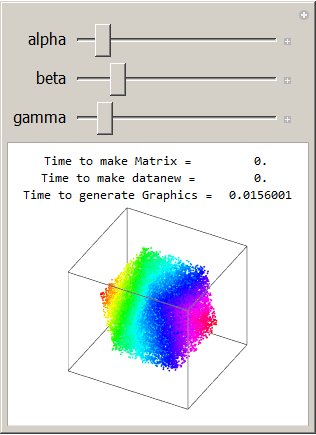
It is slow because you are using exact numbers for degrees and the matrix was not packed then. Compare the timing:

Before:

Mathematica graphics

After

Mathematica graphics

Just change this one line:

{alpha, 1, 180, 1}, {beta, 1, 180, 1}, {gamma, 1, 180, 1}]

to

{alpha, 1., 180, 1}, {beta, 1., 180, 1}, {gamma, 1., 180, 1}]
$\endgroup$
2
  • $\begingroup$ This is increadible that changing to floats everything is so much faster. How would you corotate the box frame? $\endgroup$
    – mrz
    Commented Nov 3, 2017 at 16:28
  • 1
    $\begingroup$ @mrz The corotation of the box part was later answered in the answer below. I did not add it to my answer. At the time, I just looked at why it was slow $\endgroup$
    – Nasser
    Commented Nov 3, 2017 at 16:46

Your Answer

By clicking “Post Your Answer”, you agree to our terms of service and acknowledge you have read our privacy policy.

Not the answer you're looking for? Browse other questions tagged or ask your own question.